HealthcareHealthcare & Insurance
Commercial plans pay hospitals 1.79 times the Medicare rate for outpatient care
In a hand picked sample of 22 hospitals in 17 states, the median commercial rate was 179.0% of wage adjusted Medicare. Medicare Advantage was 101.6%. Medicaid was 80.0%.

Commercial health plans pay hospitals much more than Medicare does for the same outpatient care. We measured published negotiated rates at 22 hospitals in 17 states against Medicare outpatient rates from CMS, adjusted for local wages. The median commercial rate was 179.0% of Medicare, or 1.79 times the federal benchmark. Medicare Advantage sat at 101.6%, or 1.02 times Medicare. Medicaid sat at 80.0%, or 0.80 times, in a thinner group of 14 hospitals.
That is the split that matters. Commercial plans pay 1.79 times Medicare. Medicare Advantage pays about what Medicare pays. The gap shows up in a single visit. A high complexity emergency department visit has a national Medicare rate of $608.43. The median commercial rate for the same code was $1,294.17. The Medicare Advantage median was $644.73.
The idea of reading hospital price files against Medicare comes from Yubin Park of mimilabs, who published a method note and a chart on the pattern on Nov. 13, 2026. The figures in this story are our own. We built them from the price files the 22 hospitals posted, checked against CMS’s October 2026 outpatient fee schedule.
This is a hand picked sample, not a national average. We chose the hospitals for spread, not at random, and we did not weight the results by patient volume. The medians describe these 22 files, not every U.S. hospital.
What the data shows
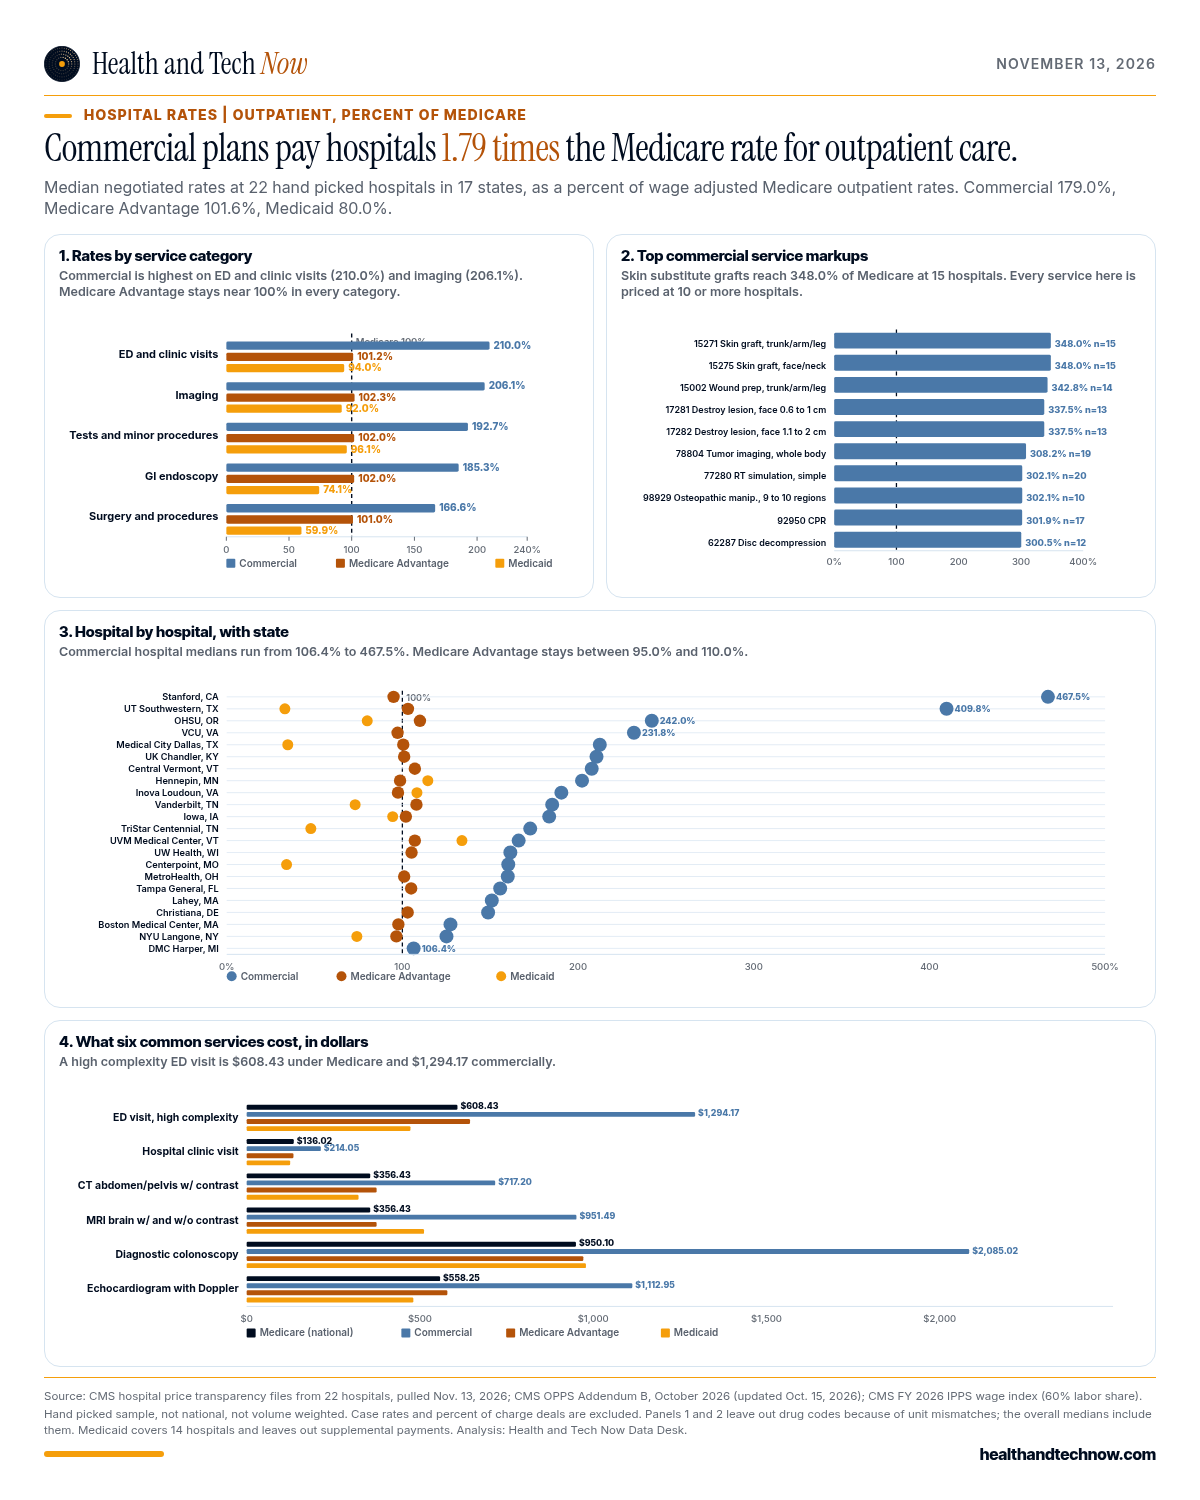
The commercial gap is wide from one hospital to the next. The hospital median runs from 106.4% of Medicare at DMC Harper University Hospital in Michigan to 467.5% at Stanford Health Care in California. Medicare Advantage is tight. At the 18 hospitals with enough MA prices to show, the median sits between 95.0% and 110.0%. That tight band is expected. Many Medicare Advantage deals are written as a percent of Medicare, so a figure near 100% is not a surprise about bargaining power.
Medicaid is a weaker read. Only 14 of the 22 hospitals had Medicaid prices we could use. The 80.0% figure is the base negotiated rate. It leaves out supplemental and directed payments, so what Medicaid actually pays is likely higher. Among the 11 hospitals with enough Medicaid cells to show, the spread runs from 33.1% to 133.9%.
We also left out two common contract types: case rates, which pay a lump sum for a stay or episode, and percent of charge deals, which set a price as a share of the hospital’s list price. Those methods do not give a clean dollar to compare with a Medicare fee schedule rate. If we put the case rate lines back in, the overall picture barely moves. Commercial would be 182.0%, Medicare Advantage 101.0%, and Medicaid 77.7%.
By service line, commercial marks up emergency and clinic visits the most, at 210.0% of Medicare, then imaging at 206.1%. Surgery sits lower, at 166.6%. Medicare Advantage stays near 101% to 102% in every category we charted. Medicaid’s lowest category in this sample is surgery, at 59.9% of Medicare, or 0.60 times the federal rate.
The biggest commercial markups on services priced at 10 or more hospitals start with skin substitute grafts on the trunk, arm or leg (CPT 15271), which have a median commercial rate of 348.0% of Medicare at 15 hospitals. Medicare’s national rate for that code is $755.08.
On everyday services, the dollar gap is direct. A diagnostic colonoscopy has a national Medicare rate of $950.10. The commercial median in this sample is $2,085.02. Medicare Advantage is $971.61, close to Medicare. An MRI of the brain is $356.43 under Medicare and $951.49 commercially.
Drug codes are in the files, and some of them show very high ratios. We left them out of the category and markup panels. The units in hospital files and in Medicare’s drug fee schedule often do not match, so those ratios can be misleading.
Why it matters
Our read: the published prices show two markets, not one. Medicare Advantage is anchored to the Medicare fee schedule. Commercial insurance is not. A patient with a commercial plan who needs a high complexity emergency visit, a colonoscopy or a brain MRI is starting from a posted rate well above Medicare. In this sample the ED visit is $1,294.17 commercially against a $608.43 Medicare rate, the colonoscopy is $2,085.02 against $950.10, and the brain MRI is $951.49 against $356.43. Employers and commercial insurers that treat “Medicare plus a little” as a default should look at the actual files. In these 22 hospitals, the commercial median is 1.79 times Medicare, and at some hospitals it is far higher.
How we got these numbers
- The sample. 22 hospitals in 17 states. We picked them by hand for spread. This is not a random sample and not a national average. One additional hospital, BSA in Texas, was pulled and then dropped because every dollar rate in its file was a percent of charges.
- The Medicare benchmark. October 2026 OPPS Addendum B, updated Oct. 15, 2026, and pulled Nov. 13, 2026. We used the national unadjusted payment rate for each separately payable HCPCS code, then adjusted it with the hospital’s FY 2026 IPPS wage index and a 60% labor share. Drugs are not wage adjusted, matching CMS.
- The rate. For each hospital, code and line of business, we took the median negotiated dollar and divided it by the wage adjusted Medicare rate. Then we took the median of those hospital and code cells. One hospital with thousands of plan lines does not swamp the rest.
- What we kept. Outpatient facility rates, a single code, no modifier, a positive negotiated dollar, and a fee schedule or “other” contract method, inside 0.1 times to 10 times Medicare. We dropped case rates, percent of charge deals, professional claims, inpatient only lines, and payers that are not commercial, Medicare Advantage or Medicaid. 1,545,724 rate lines were included. 97.72% of the CPT and HCPCS negotiated lines we read had a code in Addendum B.
- Vintage. The posted files themselves. Vintages differ by hospital. These are posted rates, not paid claims.
This story is general information from public sources. It is not financial, legal or billing advice. Johns Hopkins Hospital appears in the hook photograph as a hospital exterior. It is not one of the 22 hospitals in the rate sample.
 CMS hospital price transparency files from 22 hospitals, pulled Nov. 13, 2026
- CMS, OPPS Addendum B, October 2026, updated Oct. 15, 2026, pulled Nov. 13, 2026
- CMS, FY 2026 IPPS Tables 2, 3, 4A and 4B, wage index, pulled Nov. 13, 2026
 Yubin Park, Analyzing hospital price transparency data, LinkedIn, Nov. 13, 2026 (idea credit; figures in this story are our own)
- mimilabs, From hospital price files to meaningful rates, Nov. 13, 2026
 dhhs.ne.gov