HealthcareHealthcare & Insurance
Short-term hospital profits more than doubled after inflation. Patient care still lost money.
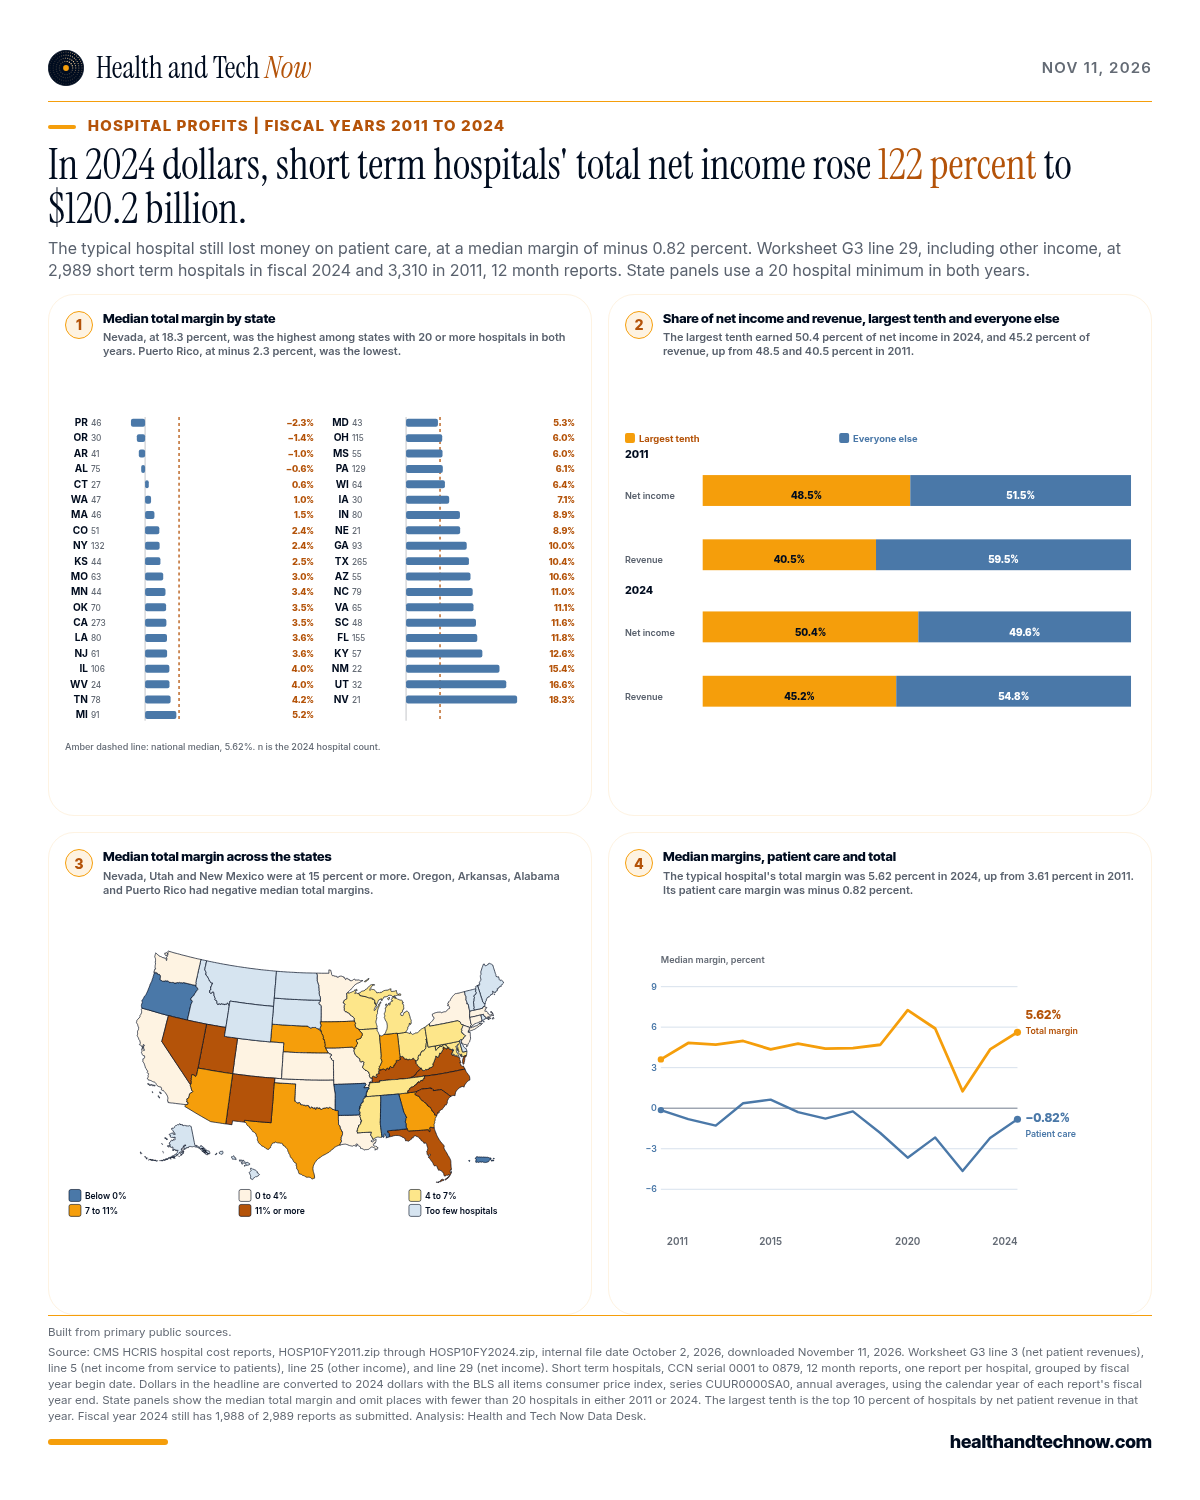
We read Medicare cost reports from U.S. short-term hospitals for fiscal 2011 through 2024. Combined net income rose 122% after inflation, to $120.2 billion. The typical hospital still lost money on patient care, and the largest tenth earned 50.4% of the profit.

U.S. short-term hospitals take in more money and keep more profit than they did in 2011. The profit does not come from treating patients. We read the cost reports these hospitals filed with Medicare for fiscal 2011 through 2024, per CMS data.
Start with patient care, which got bigger. Net patient revenue, what hospitals collect from patients and insurers, rose 38% after inflation, from $951 billion to $1,314 billion, per the cost reports. The number of hospitals fell from 3,310 to 2,989.
So the average hospital collected more. Revenue per hospital rose 53% after inflation, from $287 million to $439 million, per the same data.
Bigger did not mean more profitable.
In fiscal 2024 the median hospital’s margin on patient care was minus 0.82%, per CMS cost reports. Across all 2,989 hospitals combined, patient care lost 2.71% of patient revenue. In 2011 the combined figure was 0.00%, break even.
The profit shows up on the bottom line. Combined net income rose 122% after inflation, from $54.1 billion in 2011 to $120.2 billion in 2024. The median hospital’s total margin went from 3.61% to 5.62%, per the same CMS data.
Our read: the profit is real, and it sits outside patient care. Hospitals collected more for care, and the care itself still ran at a loss.
What the data shows
Where the profit comes from
The cost report splits the bottom line in two. Line 5 is net income from service to patients. Line 25 is total other income, which includes investment income and the COVID relief money hospitals reported, per CMS’s Worksheet G-3 definitions.
In 2024, patient care ran at a combined loss and the combined bottom line was $121.5 billion in nominal dollars, per the cost reports. Other income is what put the sector in the black. The same holds for the typical hospital, which lost money on patient care and still had a positive total margin.
Cost reports don’t break other income into investments, donations and other sources. So we can say where the profit sits, and not yet which of those sources produced it.
COVID money does not explain the rise
COVID relief flowed through other income, per the cost reports. Hospitals reported $35.9 billion of it in fiscal 2020, $13.5 billion in 2021 and $1.1 billion in 2024. That is why combined net income jumped to $126.9 billion after inflation in 2020.
Take the relief out and the long rise holds. Net income without COVID relief still rose 120% after inflation, from $54.1 billion in 2011 to $119.1 billion in 2024, per the CMS data.
The climb was not smooth. Combined net income fell to $52.2 billion in 2022, the lowest in the series after inflation. Only 55.4% of hospitals had positive net income that year, per the cost reports.
The largest hospitals take half
We ranked hospitals each year by net patient revenue, per the cost reports. In fiscal 2024 the largest tenth, 298 hospitals, collected 45.2% of patient revenue and earned 50.4% of all net income. In 2011 the largest tenth earned 48.5%.
That share moved a little, and the dollar gap moved a lot. The median hospital in the largest tenth earned $159.7 million in 2024, up 195% after inflation from $54.1 million in 2011, per the CMS data. The median hospital overall earned $11.1 million, up 121% from $5.0 million.
The bad year showed who has a cushion. In 2022 the largest tenth earned 64.1% of all net income, per the cost reports.
These are individual hospitals. The public files do not tie hospitals to their health systems, so this is a ranking of the largest hospitals, not of systems.
Where the margins are
Margins also vary by place. We looked at the 39 states and territories with at least 20 hospitals in both 2011 and 2024. For each, we found the median total margin in fiscal 2024, per the cost reports.
Nevada was highest at 18.3%. Utah, at 16.6%, and New Mexico, at 15.4%, were the only others at 15% or more. The national median was 5.62%.
Four places had a negative median total margin, per the CMS data. They were Oregon at minus 1.4%, Arkansas at minus 1.0%, Alabama at minus 0.6% and the territory of Puerto Rico at minus 2.3%. In those places the typical hospital lost money even after other income.
Why it matters to payers and Medicare
Hospital prices rose faster than prices overall. The BLS index for hospital and related services rose 69.8% from 2011 to 2024. All consumer prices rose 39.5%, per BLS.
Our read: when a hospital asks a health plan for a higher rate, it points to the patient care margin. That number is negative, and it is real. So is a bottom line that more than doubled after inflation.
Payers should ask for both numbers in every rate talk.
Under CMS’s AHEAD model, a participating hospital gets a global budget, a set amount of Medicare fee for service revenue for the year, per CMS. Maryland started in January 2026. Connecticut, Hawaii, Rhode Island and New York start Jan. 1, 2028.
Our read: a global budget sets patient revenue in advance, and other income sits outside it. A hospital with a big bottom line outside patient care starts that test with a cushion. A hospital without one starts below zero on patient care.
How we got these numbers
- The hospitals. We downloaded CMS’s hospital cost report files for fiscal 2011 through 2024 (HOSP10FY2011.zip through HOSP10FY2024.zip, dated Oct. 2, 2026) on Nov. 11, 2026. We kept short-term hospitals, meaning Medicare provider numbers ending 0001 to 0879, with reports of 360 to 370 days, patient revenue above zero and one report per hospital. Critical access, psychiatric, rehabilitation, long-term care hospitals and children’s hospitals use other number ranges and are not counted.
- Fiscal years. We grouped reports by federal fiscal year of the start date. Fiscal 2024 means fiscal years that began Oct. 1, 2023 through Sept. 30, 2024.
- The margins. Patient care margin is Worksheet G-3 line 5, net income from service to patients, divided by line 3, net patient revenues. Total margin is line 29, net income, divided by line 3 plus line 25, total other income.
- After inflation. “After inflation” and “real” mean 2024 dollars. We multiplied each hospital’s figures by the 2024 BLS CPI-U all items annual average (313.689) divided by the annual average for the calendar year its fiscal year ended. Some fiscal 2024 reports end in 2025, so real 2024 revenue sits slightly below the nominal $1,328.7 billion.
- Before inflation. In nominal dollars, net patient revenue rose 93.2% and net income rose 211%, from $39.1 billion to $121.5 billion, per the cost reports.
- COVID relief. Net income without COVID relief is line 29 minus line 24.50, COVID public health emergency funding.
- Outliers. Trimming each hospital’s 2024 net income at the 1st and 99th percentiles gives $116.1 billion instead of $121.5 billion, per our sensitivity check. The published totals and medians are untrimmed.
- Still settling. Of the 2,989 fiscal 2024 reports, 1,988 were still as submitted when CMS dated the file, per CMS. Later settlements can revise them.
This story is general information from public sources. It is not financial, legal or billing advice.
 CMS, Hospital Cost Report (HCRIS) Form 2552-10 data files HOSP10FY2011.zip through HOSP10FY2024.zip, dated Oct. 2, 2026, downloaded Nov. 11, 2026
 CMS, Provider Reimbursement Manual 15-2, chapter 40, transmittal 26 (June 30, 2026), Worksheet G-3 line definitions
- U.S. Bureau of Labor Statistics, CPI-U series CUUR0000SA0, all items, U.S. city average, annual averages (read Nov. 11, 2026)
- U.S. Bureau of Labor Statistics, CPI-U series CUUR0000SEMD, hospital and related services, U.S. city average, annual averages (read Nov. 11, 2026)
- CMS Innovation Center, AHEAD Model page (read Nov. 11, 2026)
- CMS Innovation Center, Maryland Total Cost of Care Model page (read Nov. 11, 2026)


 Health and Tech Now