EN, página actualES
Subscribe, it's free
SAMPLES · Data Desk

See the file before you buy it.

Every product below has a sample built from public government and financial records. Open the PDF. Check any number against its source line.

SAMPLE builds, not client work. Built Oct 24, 2026. CMS hides counts of 10 or fewer, so member totals are floors.

Year round

Your market, every month

Monthly and yearly plans, plus the one time checks a team buys between them.

State Desk

The problemYour state’s market moves every month, and you have no time to pull the CMS file yourself.

$250per month, or $2,500 a year (two months free). Month to month, cancel anytime.
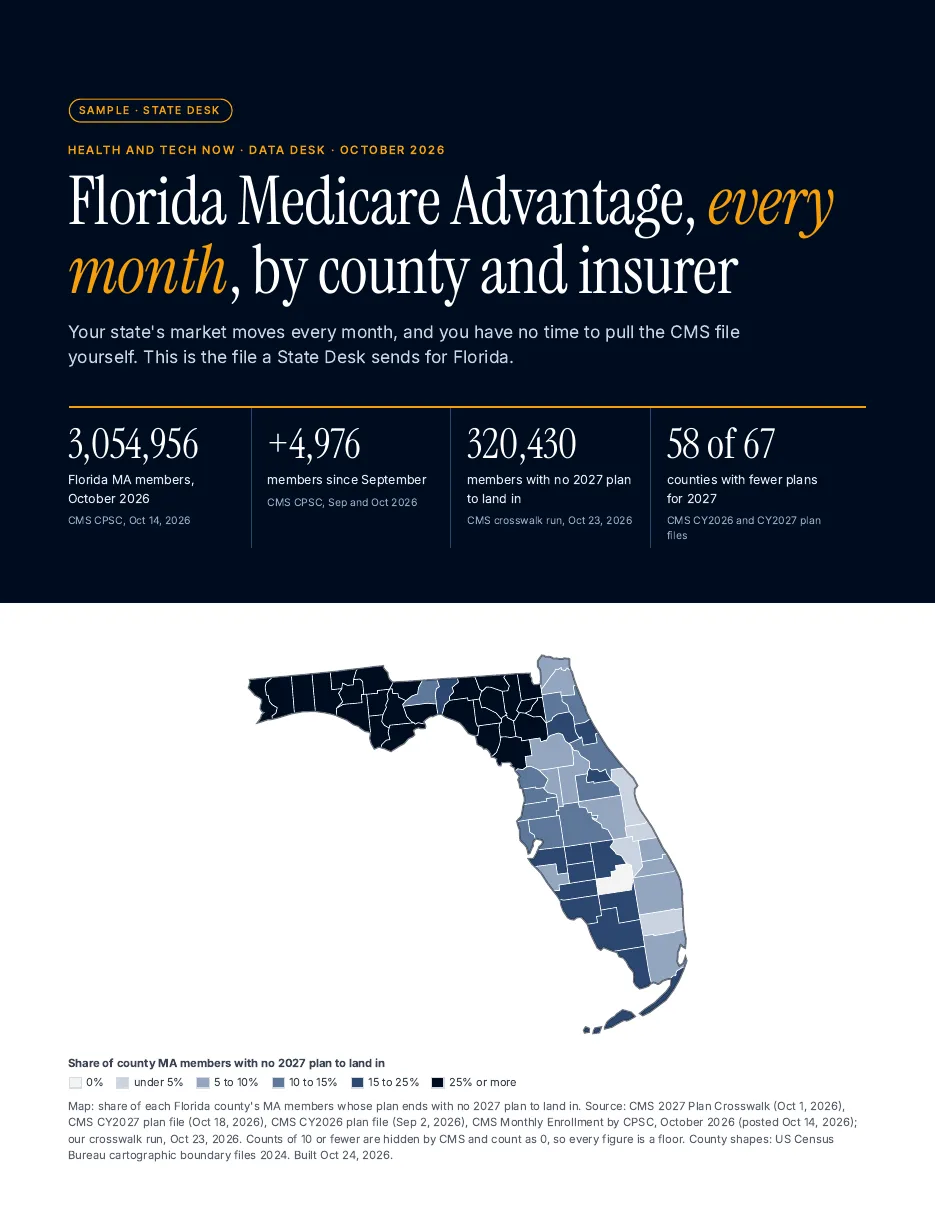
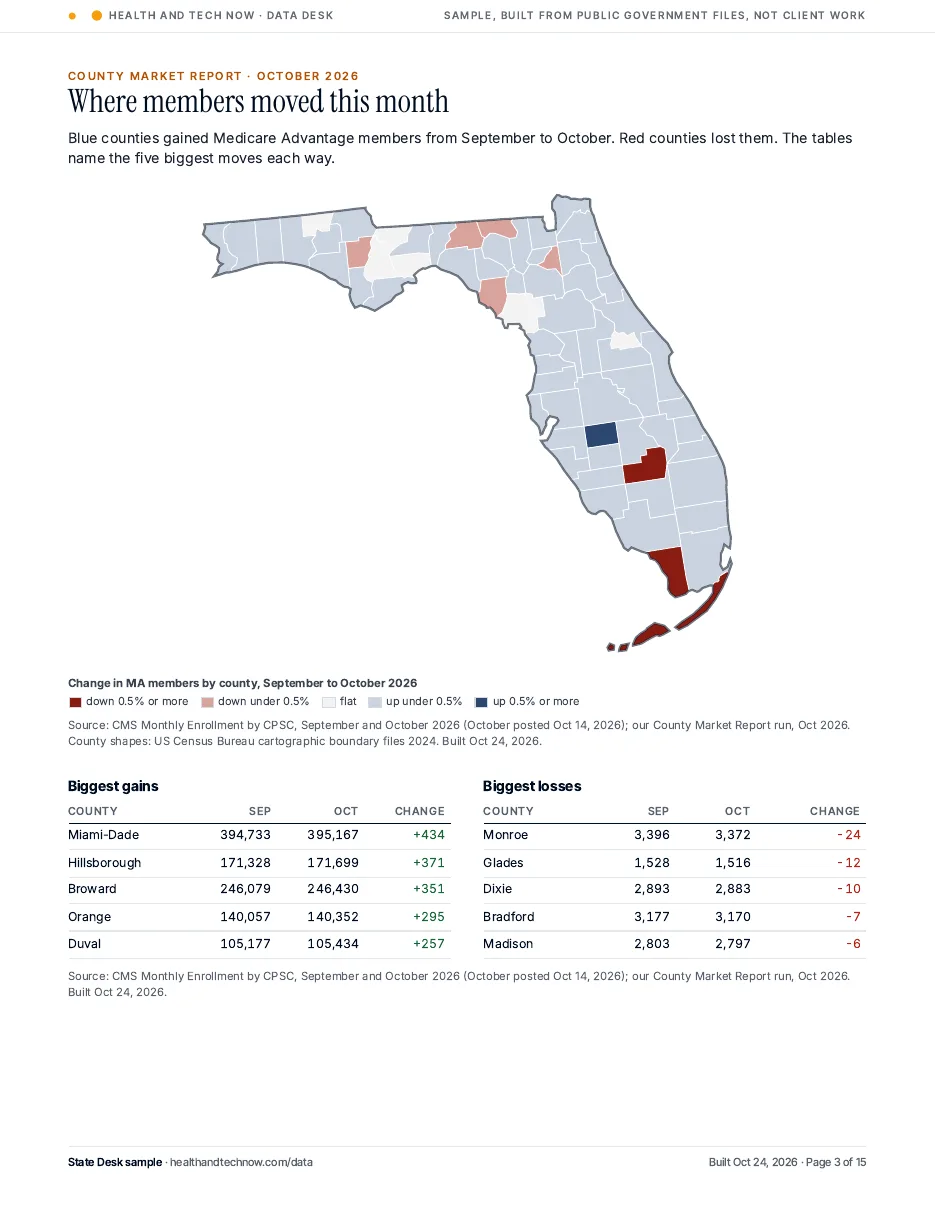
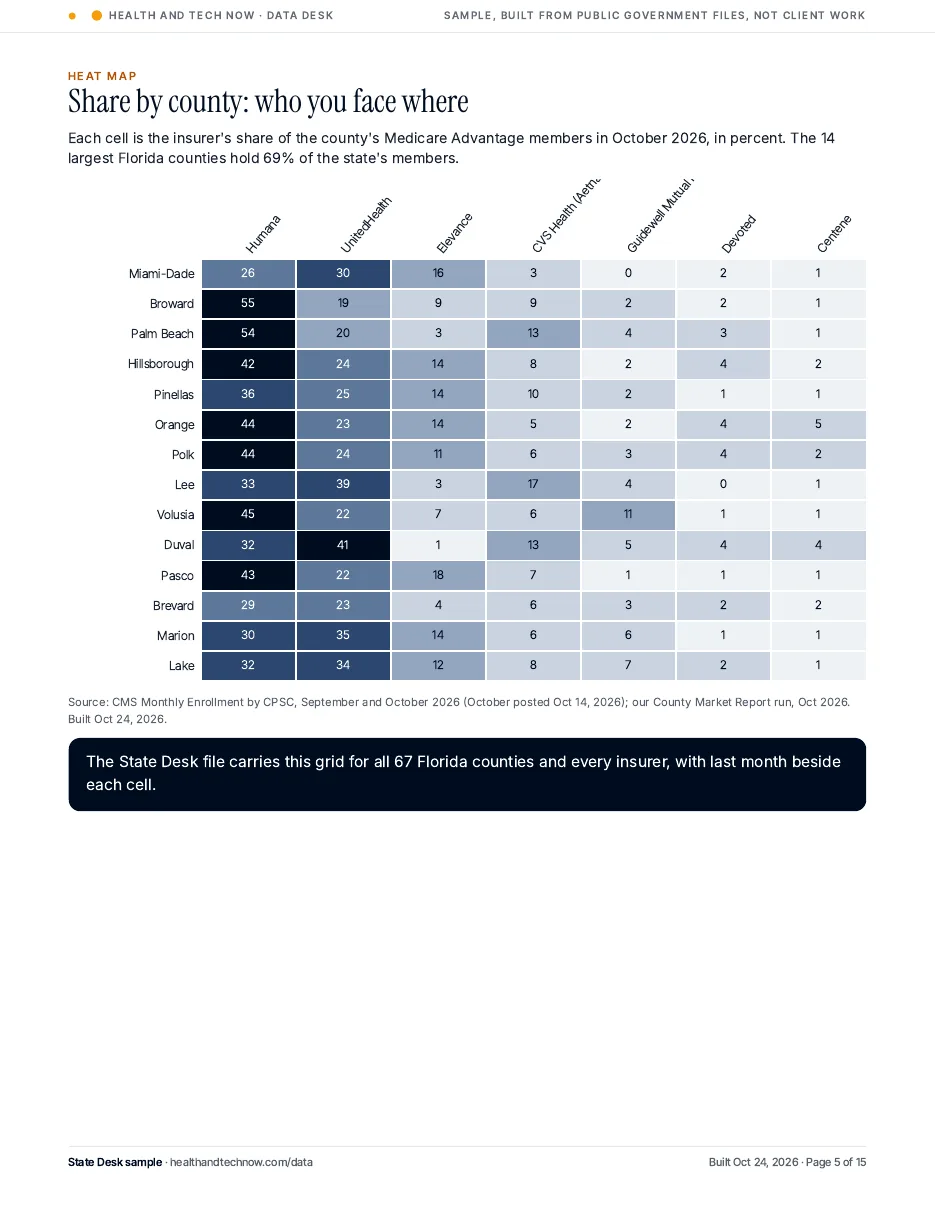
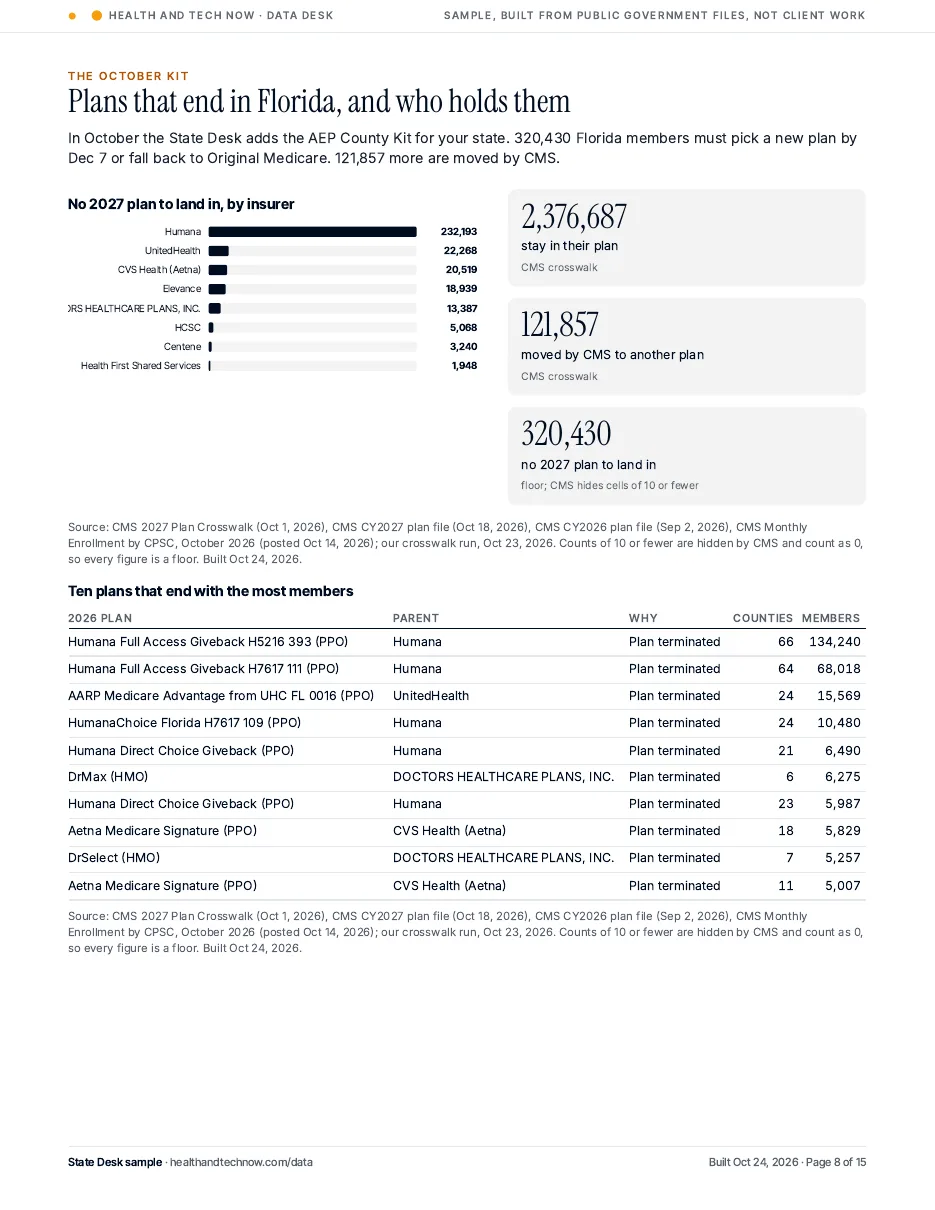
Cover of the State Desk sample for Florida with a county map of members who have no 2027 plan to land inFlorida county map of Medicare Advantage members gained and lost from September to October 2026Heat map of insurer share in the 14 largest Florida countiesFlorida plans that end for 2027, by insurer, with the ten largest plans

What you get

  • One state’s County Market Report every month
  • The AEP County Kit in October
  • A February landing report
  • One short question a month
  • A feed key for your state’s JSON file

Within 3 business days of each CMS monthly release.

In the sample

  • 4 Florida county maps: monthly change, no plan to land in, stars, plan count change
  • Insurer share and one month change bars
  • Insurer share by county heat map
  • Plan type mix and the ten biggest plan moves
  • Contract stars table and the October kit
  • County map of MA members per 100 residents 65+ (Census ACS) and an income scatter (BEA)
  • County map of exits per 1,000 residents 65+
  • Federal Register box: CMS rules and notices in the last 30 days
  • County map of uninsured ages 50 to 64 (Census SAHIE) and Social Security beneficiaries 65+ by county (SSA)

Sources: CMS Monthly Enrollment by CPSC (Sep and Oct 2026), Plan Crosswalk, CY2026 and CY2027 plan files, 2027 Star Ratings, MA Penetration. Maps: US Census Bureau cartographic boundary files. Census ACS 2020 to 2024 (table B01001); BEA per capita personal income 2024 (CAINC1); Federal Register API; SSA OASDI Beneficiaries by State and County (Dec 2024); Census SAHIE 2023.
Agent Desk

The problemYour clients’ plans change every year, and you find out when they call you.

$99per month, or $990 a year (two months free). Up to 10 counties in one state.
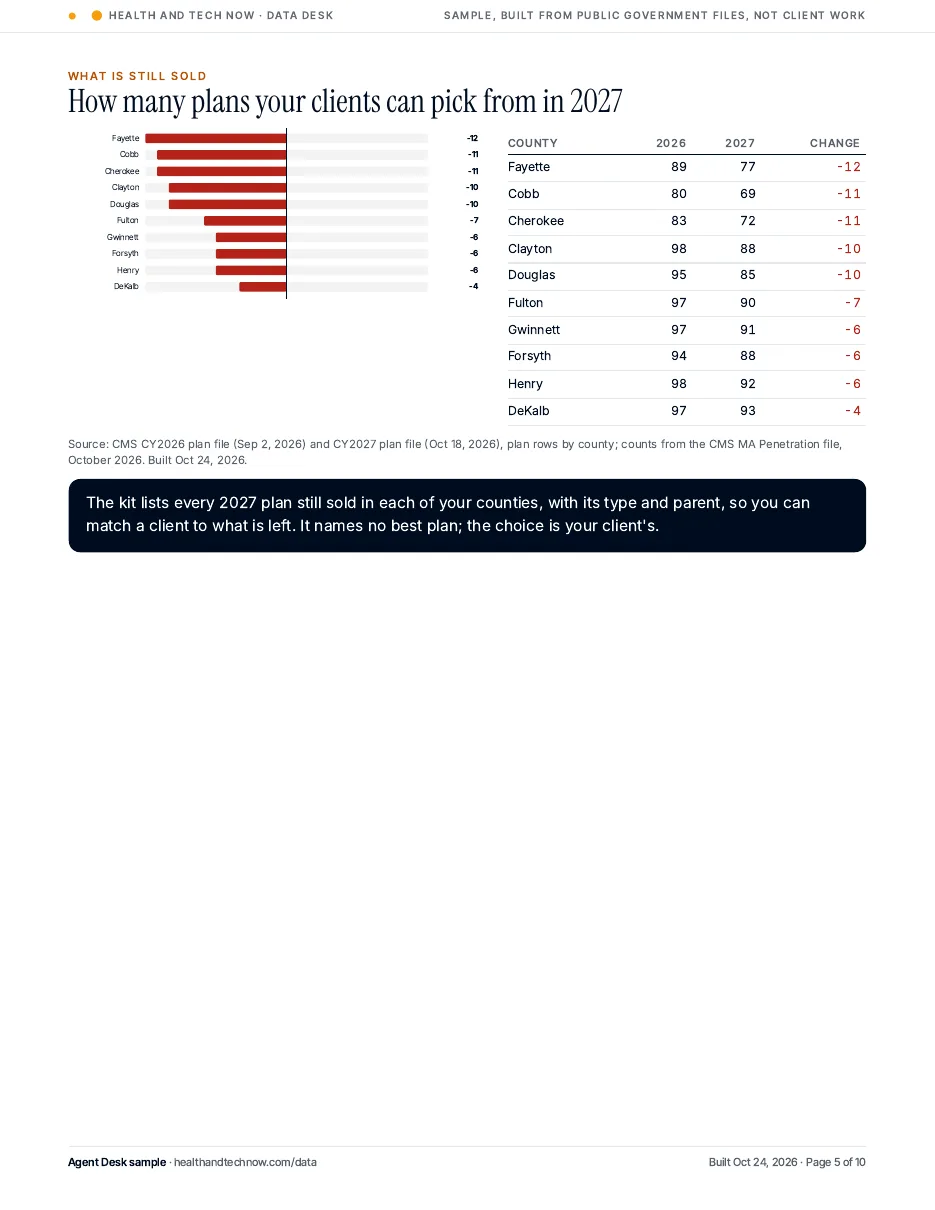
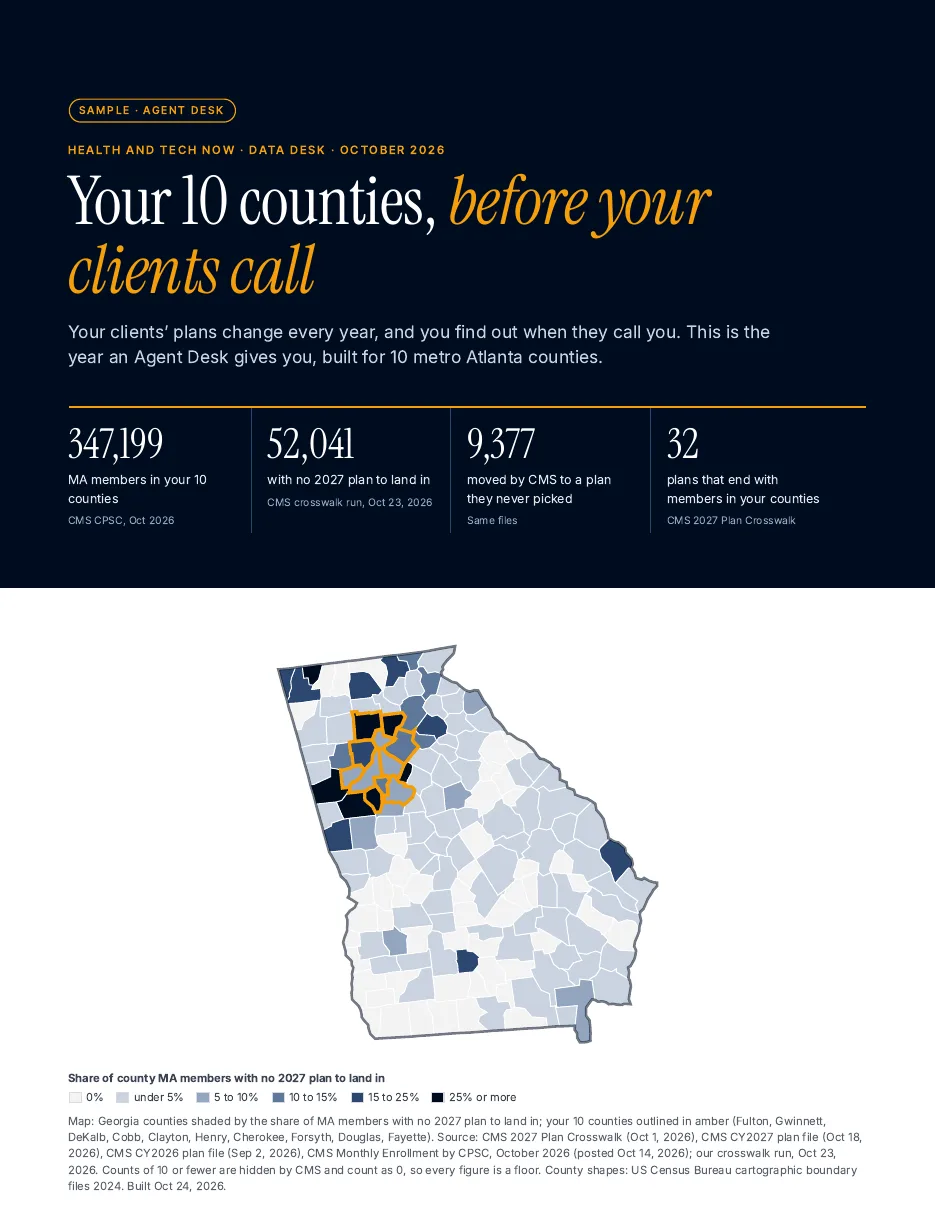
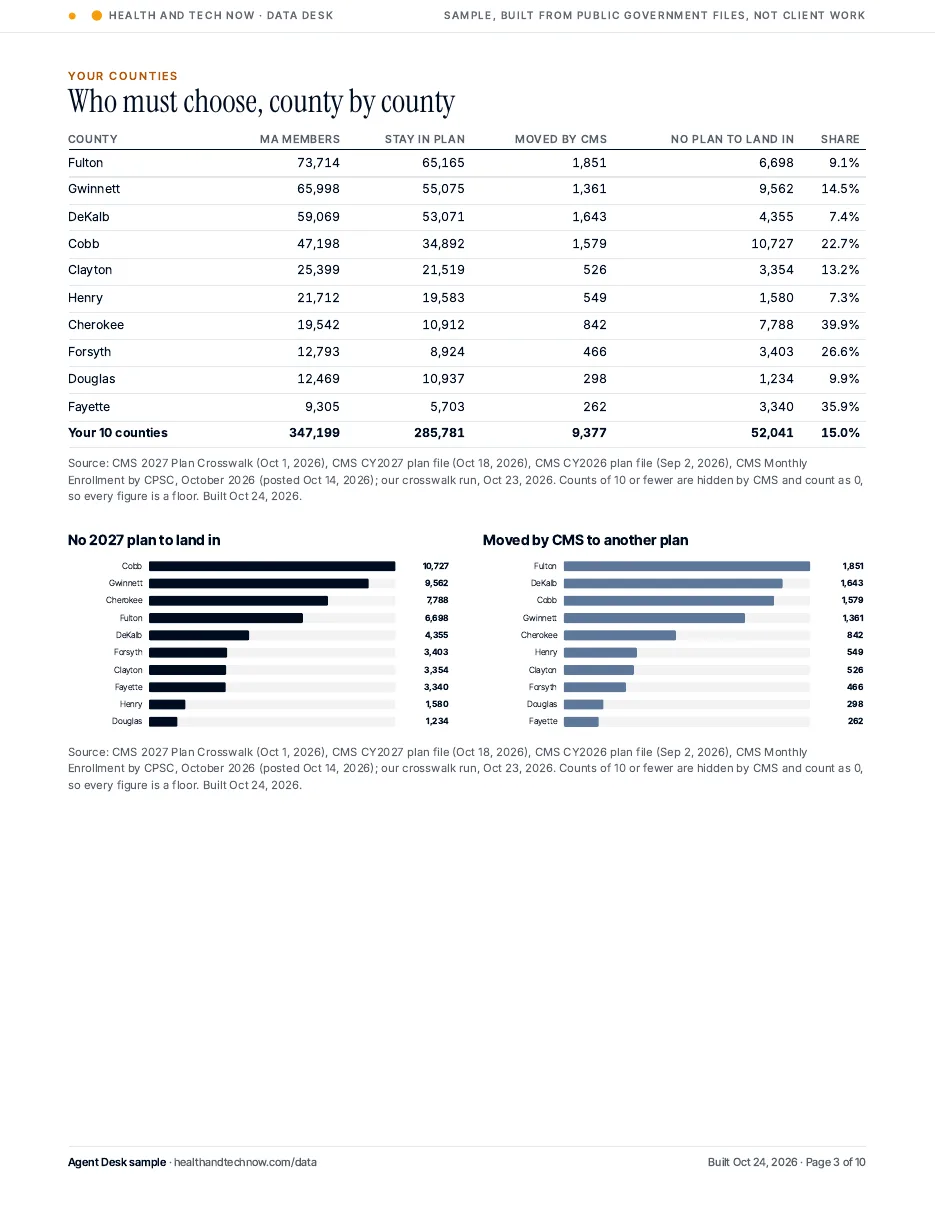
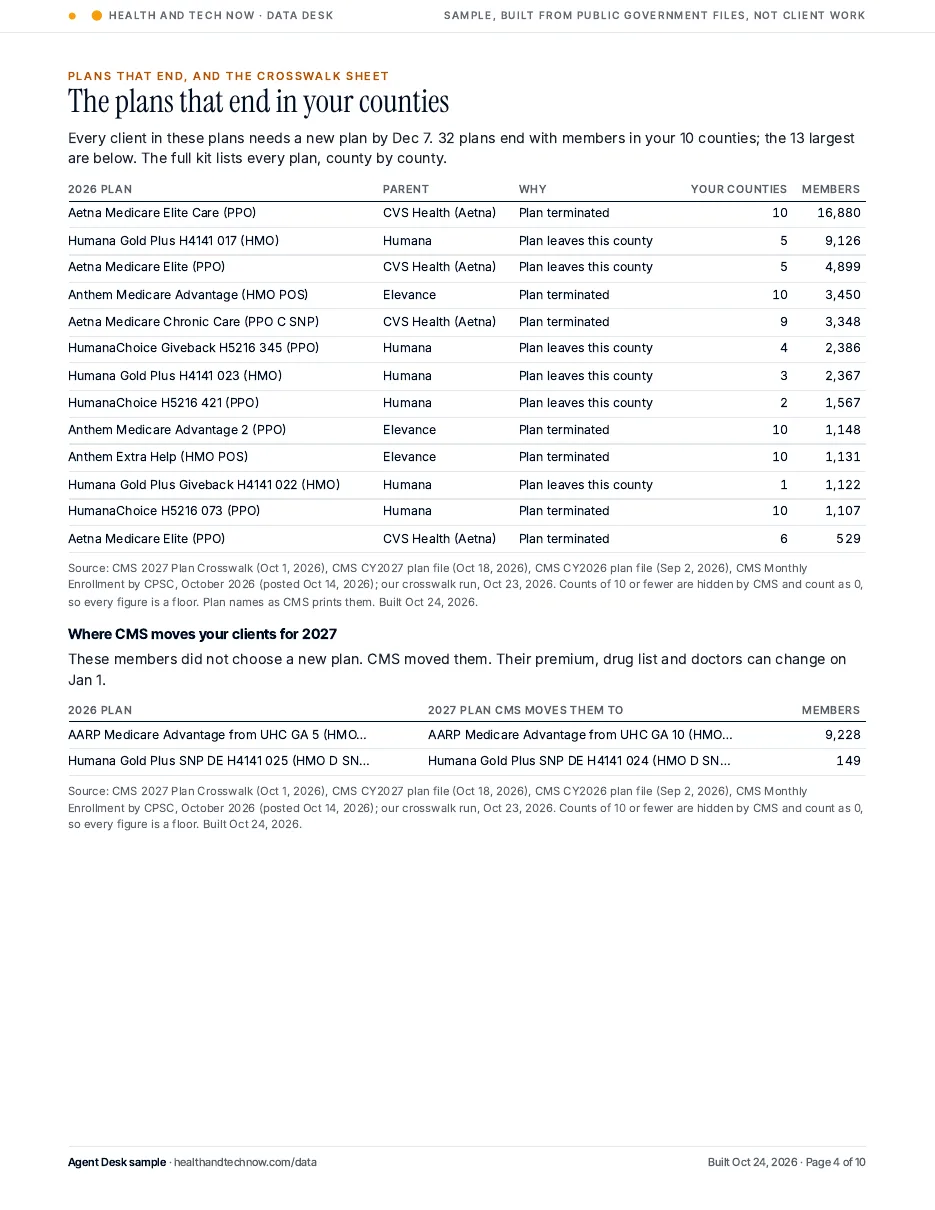
Cover of the Agent Desk sample with a Georgia county map and 10 metro Atlanta counties outlinedTable and bars of members who must choose a 2027 plan in each of the 10 countiesPlans that end in the 10 counties and where CMS moves members for 2027Change in plans offered in each county, 2026 to 2027

What you get

  • A report on your counties every month
  • The AEP County Kit with the crosswalk sheet for those counties in October
  • A February landing report

Within 3 business days of each CMS monthly release.

In the sample

  • Georgia county map with your 10 counties outlined
  • County table and bars: no plan to land in, moved by CMS
  • Plans that end and the crosswalk sheet
  • Plan count change by county
  • Monthly county report and insurer share bars
  • Your counties by residents 65+, MA members per 100 seniors, income and chronic disease
  • Uninsured ages 50 to 64 by county (Census SAHIE) and ZIPs ranked by returns filed by people 60+ (IRS SOI)

Sources: CMS Plan Crosswalk, CY2026 and CY2027 plan files, Monthly Enrollment by CPSC (Sep and Oct 2026), MA Penetration. Maps: US Census Bureau cartographic boundary files. Census ACS 2020 to 2024 (table B01001); BEA per capita personal income 2024; CDC PLACES 2025 release; Census SAHIE 2023; IRS SOI ZIP Code data, tax year 2022.

Group plan

The problemYour team works three states and watches one rival, and everyone pulls their own numbers.

$750per month, or $7,500 a year (two months free). Three month minimum.
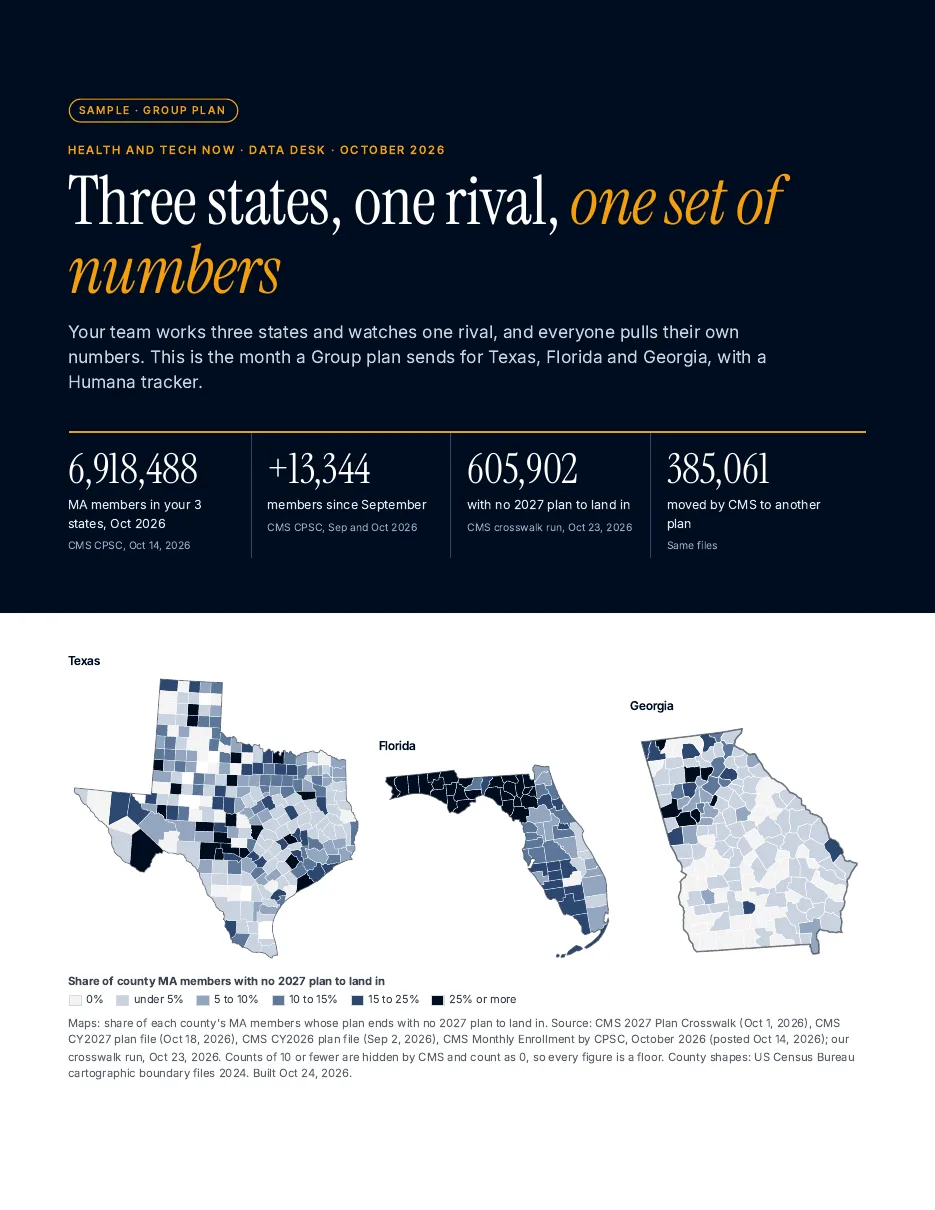
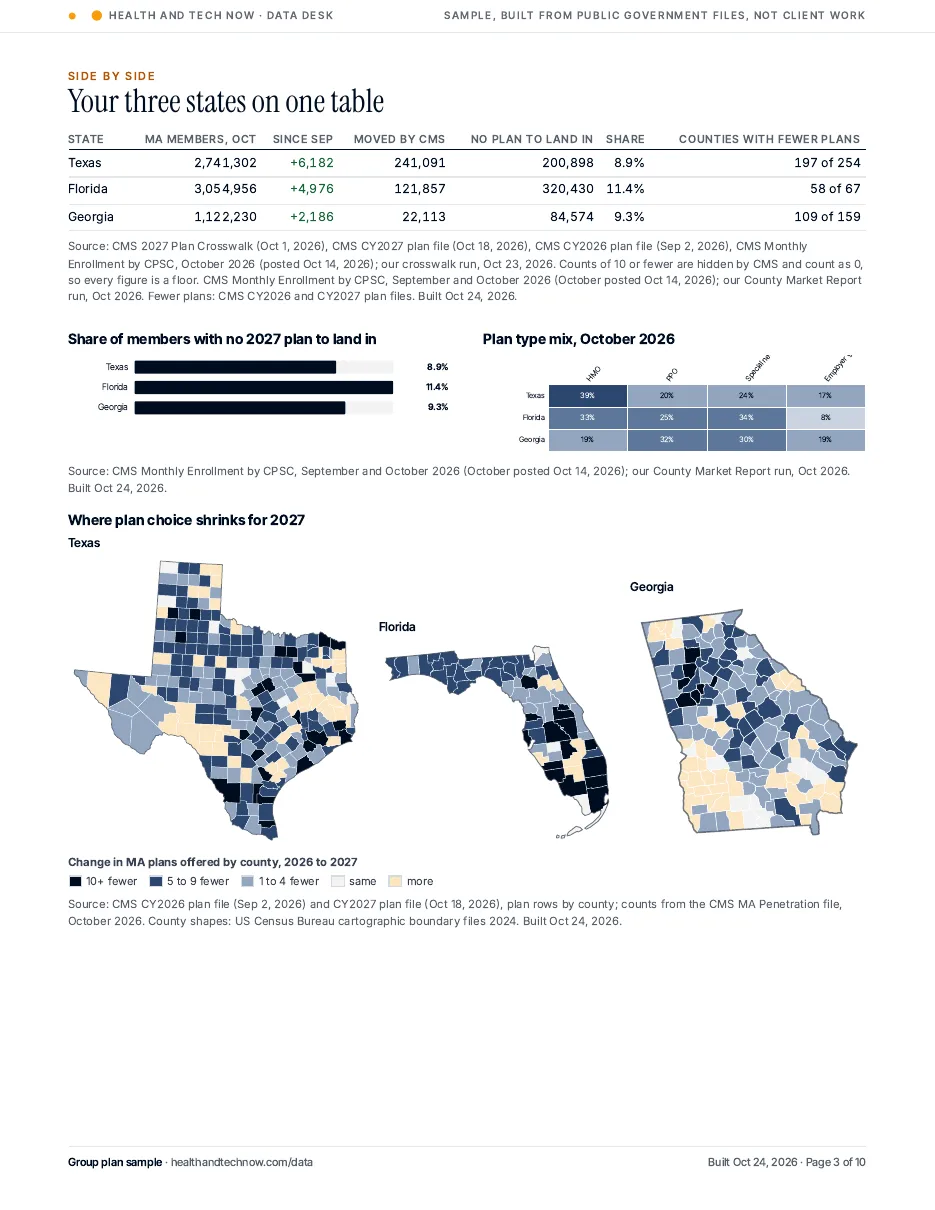
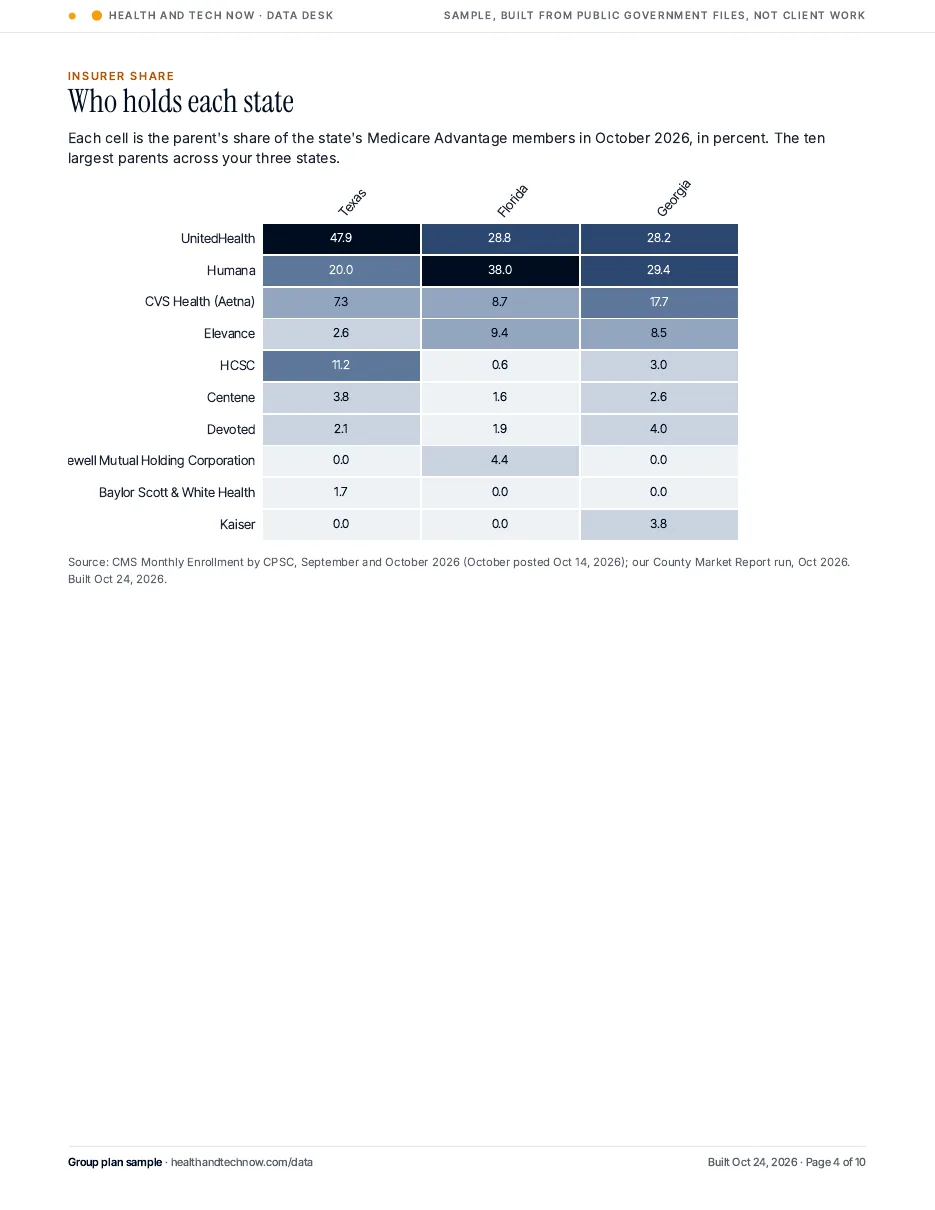
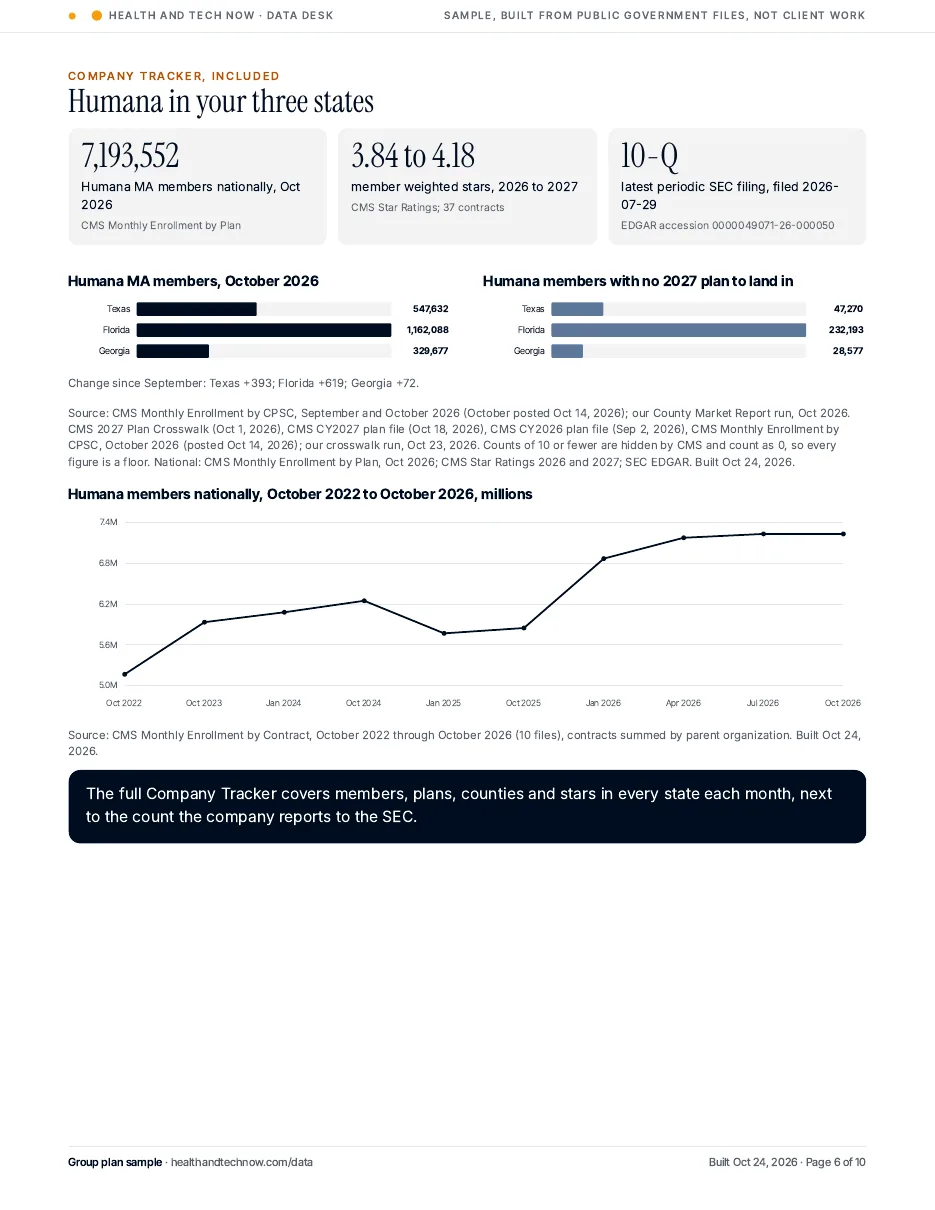
Cover of the Group plan sample with county maps of Texas, Florida and GeorgiaThree states side by side: table, bars, plan type heat map and plan count change mapsHeat map of parent organization share in Texas, Florida and GeorgiaCompany Tracker page for Humana in the three states with a five year trend line

What you get

  • Up to 3 states every month
  • 1 Company Tracker
  • October kits with the share license
  • A February landing report
  • 2 briefs a month
  • A feed key for your 3 states

Within 3 business days of each CMS monthly release. Briefs in 5 business days.

In the sample

  • Three state county maps: no plan to land in and plan count change
  • Side by side state table and plan type heat map
  • Parent share heat map across the three states
  • One month movers by state
  • Humana tracker: state bars and a five year trend
  • Two sample briefs
  • Federal Register box and a three state table by residents 65+, income and chronic disease

Sources: CMS Monthly Enrollment by CPSC, by Plan and by Contract, Plan Crosswalk, CY2026 and CY2027 plan files, Star Ratings, SEC EDGAR. Maps: US Census Bureau cartographic boundary files. Census ACS 2020 to 2024; BEA per capita personal income 2024; CDC PLACES 2025 release; Federal Register API.

Enterprise plan

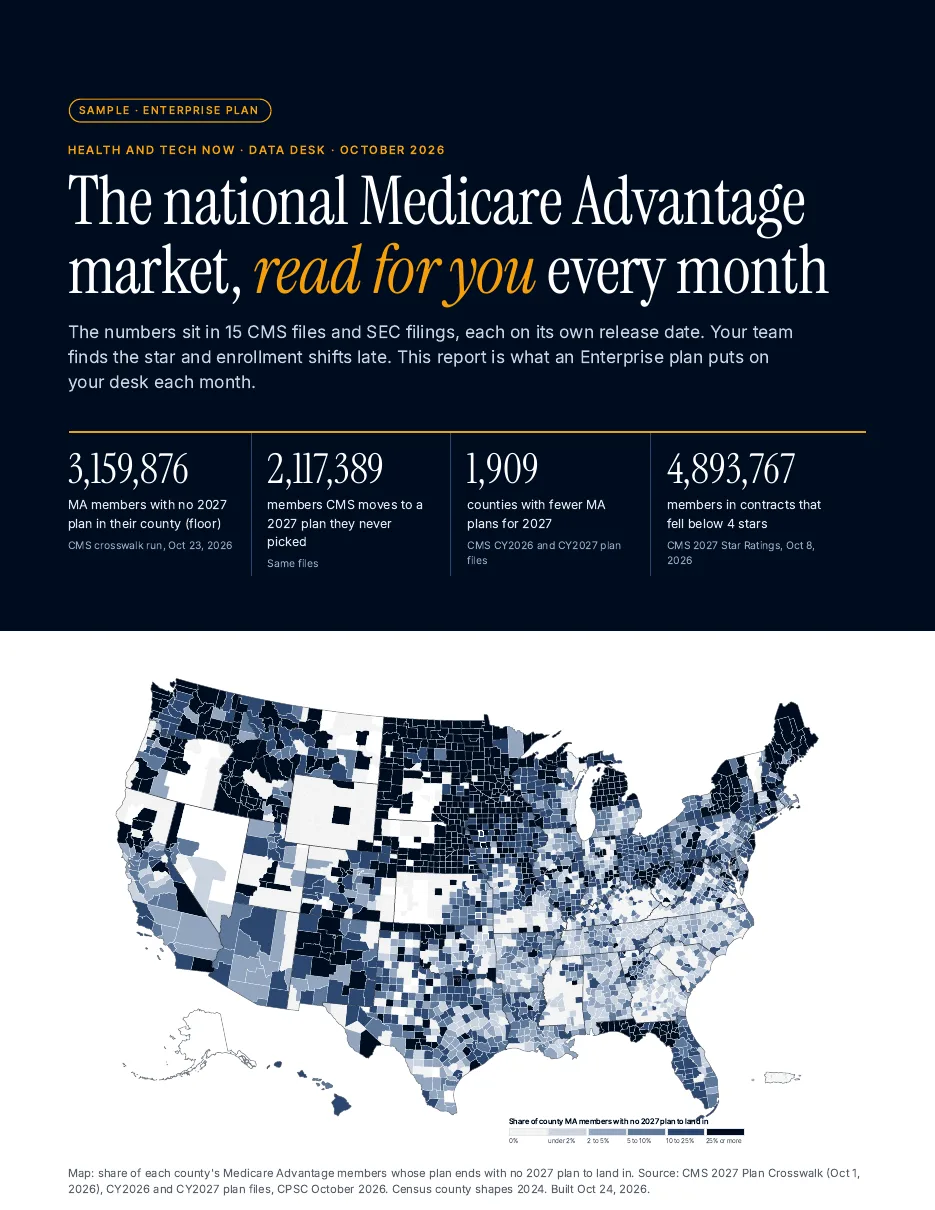
The problemThe numbers sit in 15 CMS files and SEC filings, each on its own release date. Your team finds the shifts late.

$2,000per month, or $20,000 a year (two months free). Six month minimum.
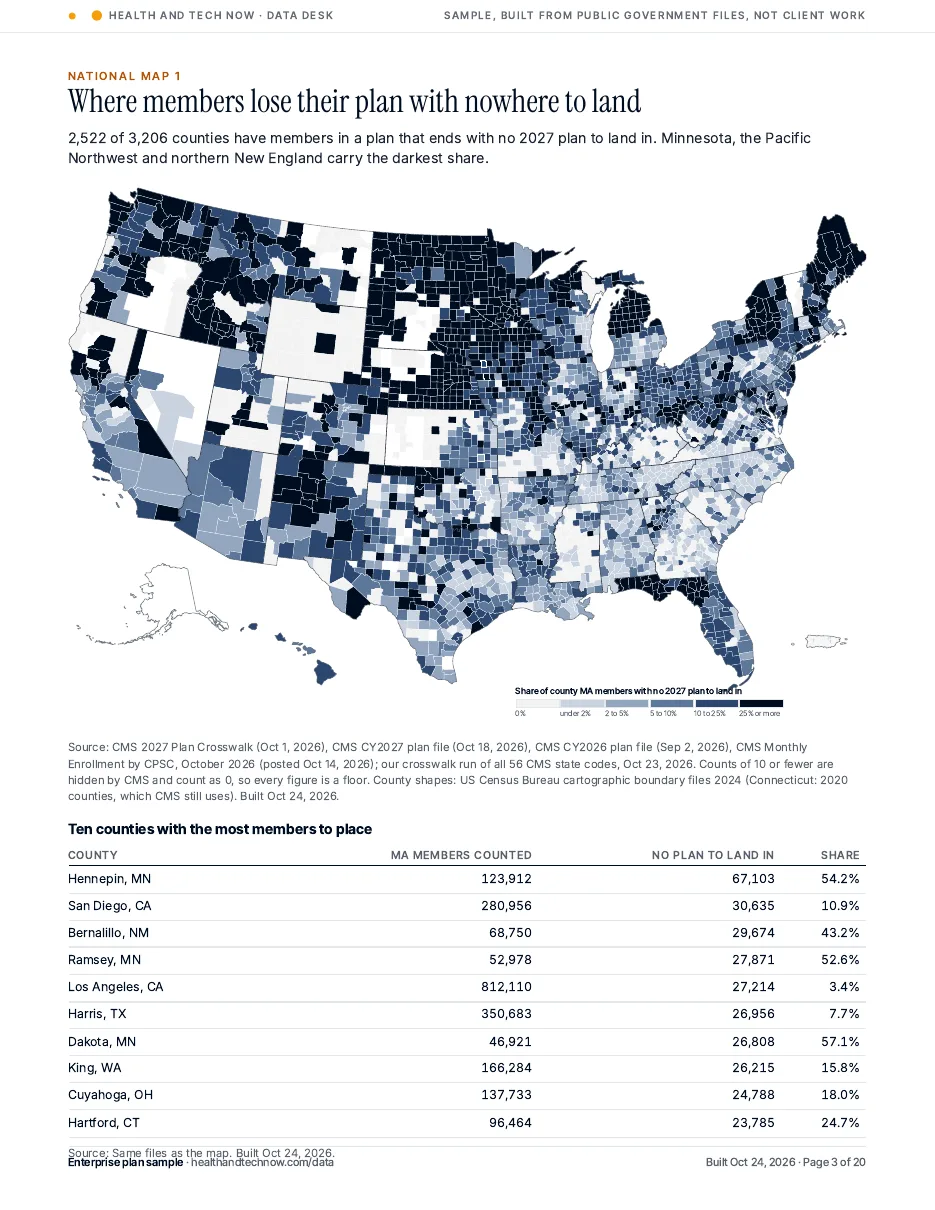
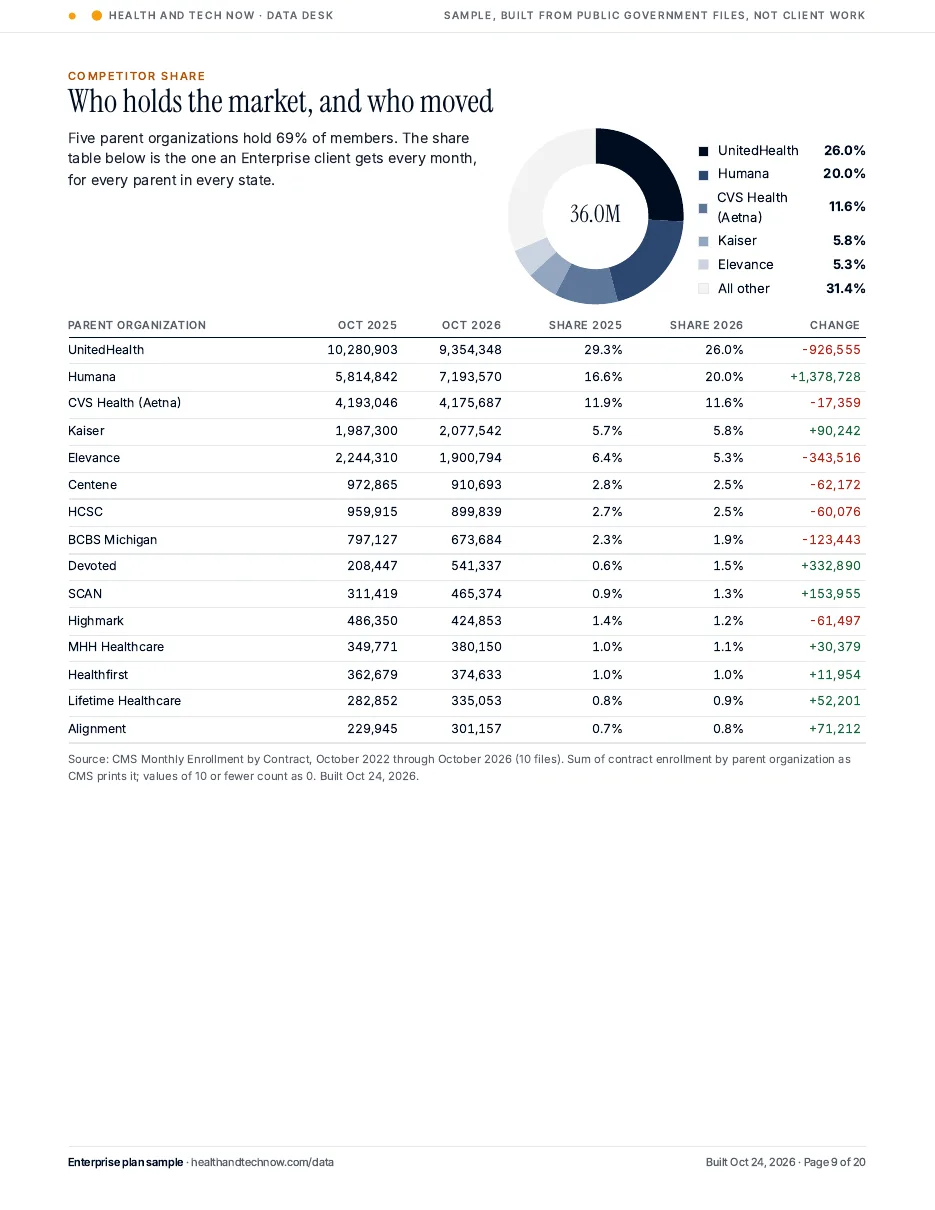
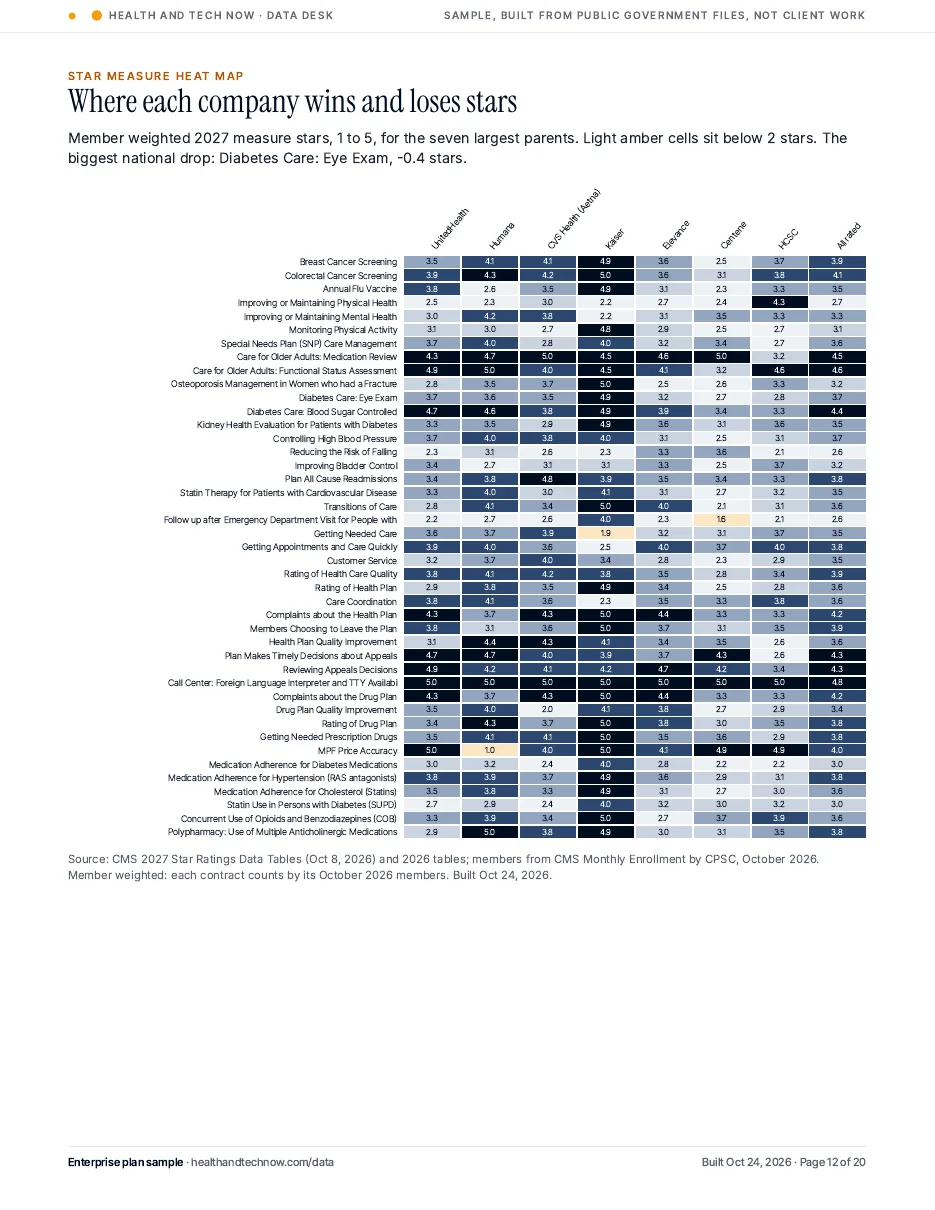
Cover of the Enterprise sample with a national county map of members who have no 2027 plan to land inNational county map: share of Medicare Advantage members with no 2027 plan in their county, with the top 10 countiesCompetitor share table for the largest parent organizations, October 2025 and October 2026, with a share donutHeat map of 43 star measures by parent organization, member weighted 2027 stars

What you get

  • All states every month, by county and insurer
  • Up to 3 Company Trackers
  • The national October kit and stars change sheet
  • A February landing report
  • 1 Claim Check a quarter
  • 1 full brief and 2 short questions a month
  • The AEP 2027 County Kit for FMOs for every state, with the right to share it
  • AEP County Kits and County Sheets for every state and county
  • 10 Agent Desk seats you give to your own agents
  • A feed key for every state
  • At list prices the trackers, Claim Checks, briefs, kits and seats add up to $114,300 a year. Enterprise is $20,000 a year.

Within 3 business days of each CMS monthly release. Brief and Claim Check in 5 business days.

In the sample

  • 3 national county maps: no plan to land in, plan count change, penetration
  • State rankings and a state map
  • Five year enrollment trend by parent
  • Competitor share table and parent share by state heat map
  • Plan type mix and star measure heat maps
  • Plan exit exposure by company and a Claim Check
  • US county map of exits per 1,000 residents 65+ (Census ACS join)
  • US county map of adult diabetes (CDC PLACES) with the counties hit hardest
  • Schedule H community benefit bars for nonprofit hospitals (IRS 990)
  • Hospital operating margins by Care Compare star rating, urban against rural (CMS cost reports and Care Compare)

Sources: CMS Plan Crosswalk, CY2026 and CY2027 plan files, Monthly Enrollment by CPSC and by Contract, MA Penetration, 2027 Star Ratings, SEC 8-K. Maps: US Census Bureau cartographic boundary files. Census ACS 2020 to 2024 (table B01001); CDC PLACES 2025 release; IRS Form 990 Schedule H (TEOS batches 07A to 09A, 2026); CMS Hospital Provider Cost Reports (HCRIS, FY2023 reports, updated Oct 5, 2026); CMS Care Compare Hospital General Information (Jul 22, 2026).

Company Tracker

The problemYou learn about an insurer’s member and star moves on its earnings call.

$350per company, per month. Three month minimum.
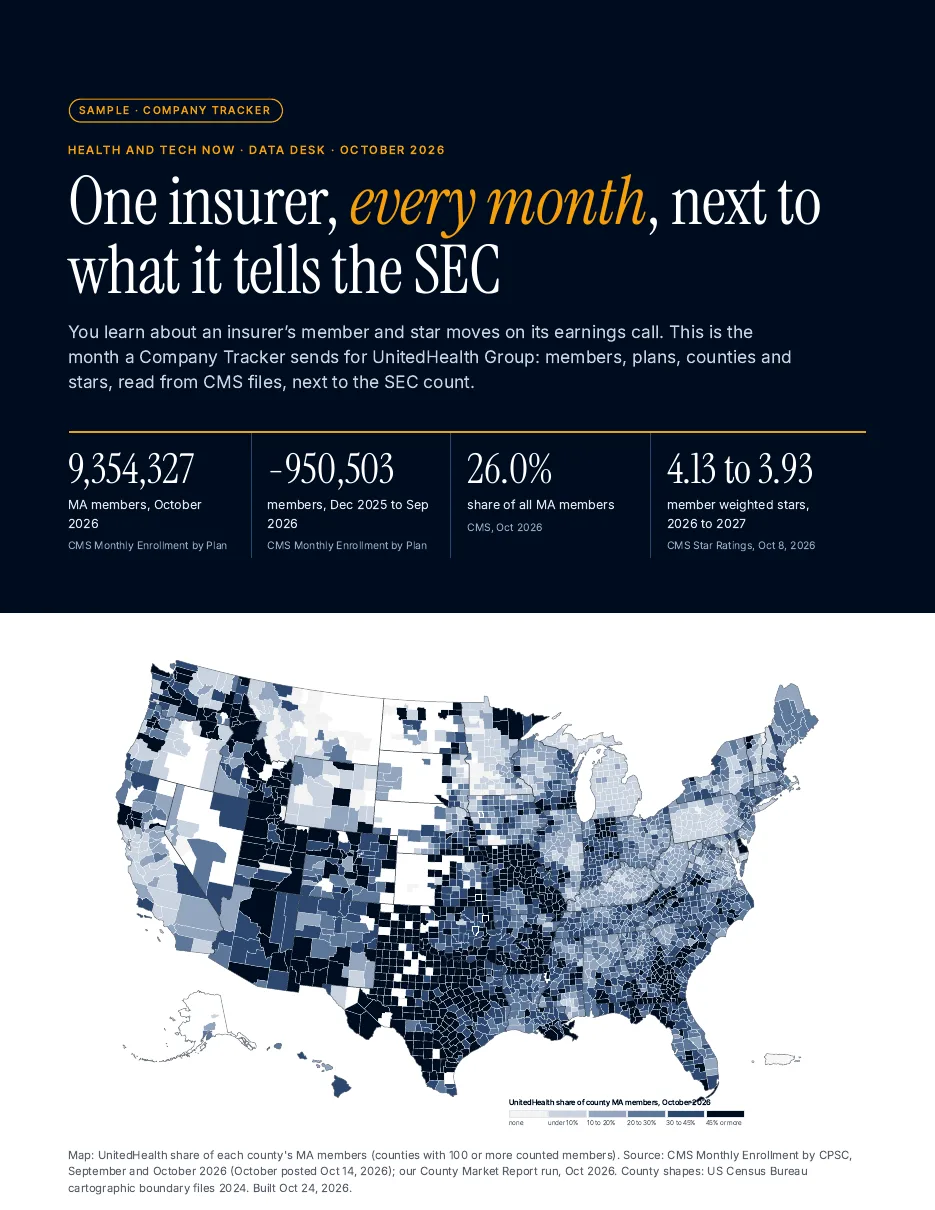
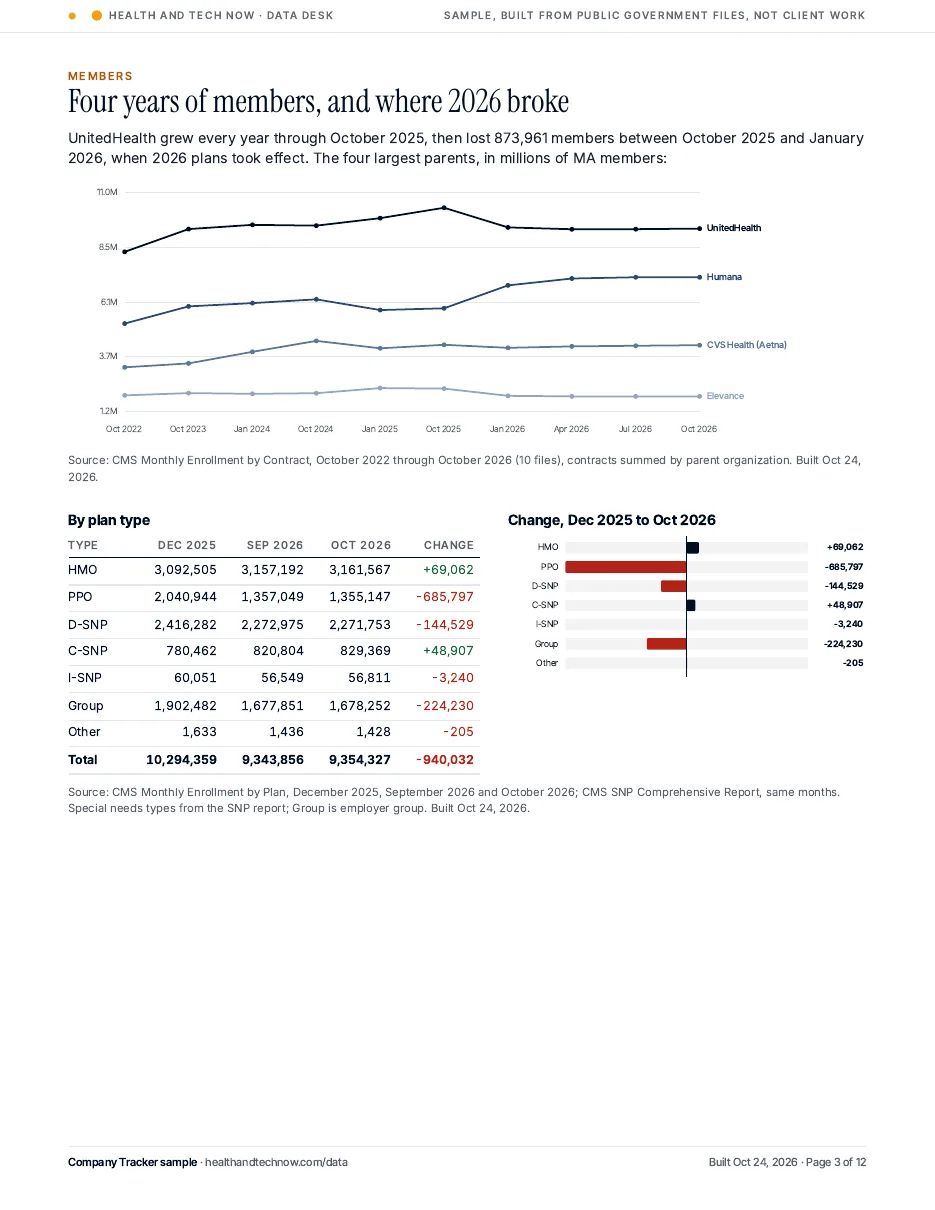
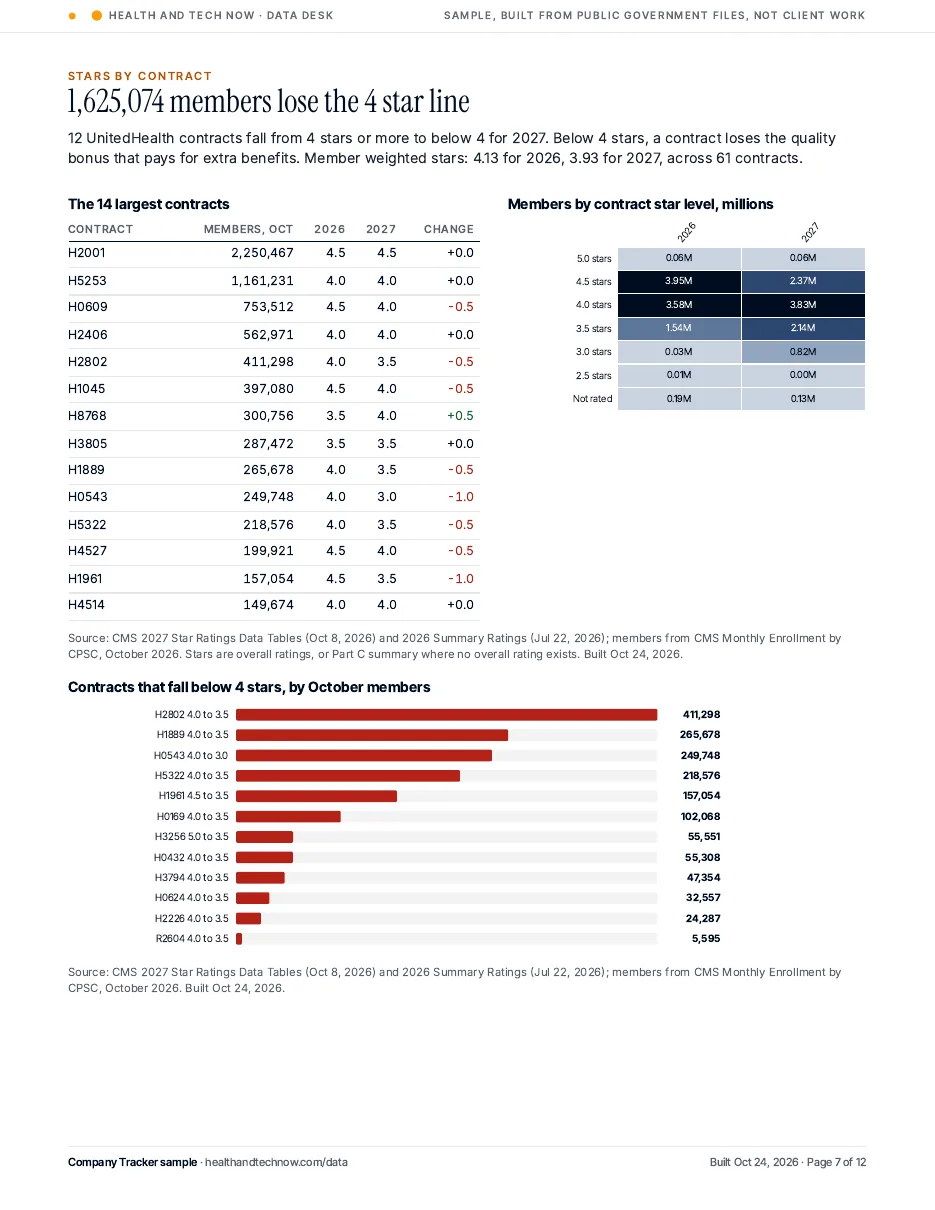
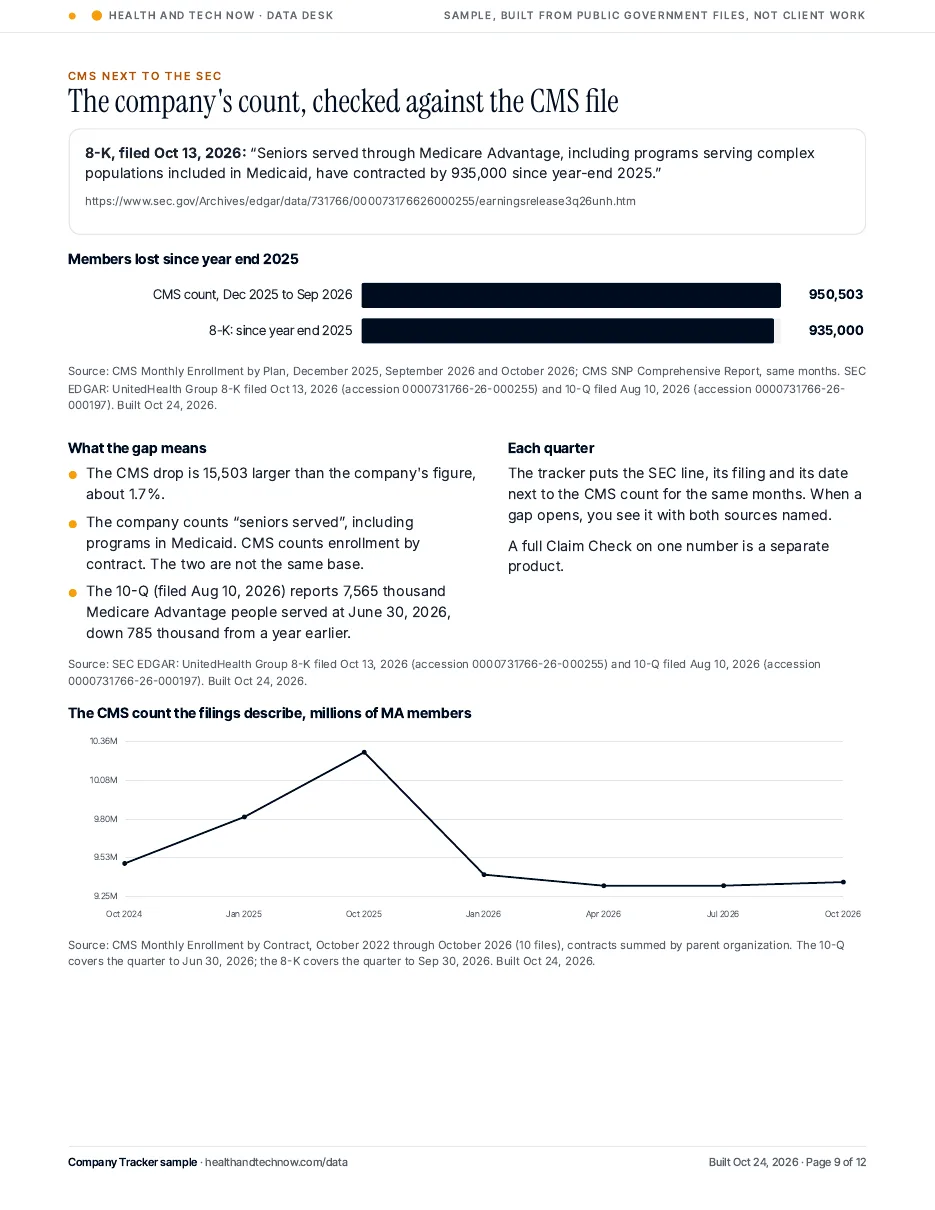
Cover of the Company Tracker sample with a national county map of UnitedHealth shareFour year member trend for the four largest parents and UnitedHealth members by plan typeUnitedHealth contracts by star rating, 2026 against 2027The 8-K member claim next to the CMS count, with a two year trend

What you get

  • One insurer’s members, plans, counties and stars every month
  • Its SEC member count next to the CMS count each quarter
  • Star changes measure by measure when CMS posts ratings
  • A one page summary and the file

Within 3 business days of each CMS monthly release.

In the sample

  • National county map of UnitedHealth share
  • Four year trend lines, four largest parents
  • Plan type table and change bars
  • State share map and top 15 states
  • Month change by state and county
  • Plans that end for 2027, by state
  • Stars by contract and contracts falling below 4
  • Measure by measure star heat map
  • CMS count next to the 8-K and 10-Q
  • Health tech watchlist: FDA 510(k) clearances by company and month, and ClinicalTrials.gov studies by status

Sources: CMS Monthly Enrollment by Plan, Contract and CPSC; SNP Comprehensive Report; 2027 Plan Crosswalk; 2026 and 2027 Star Ratings; SEC EDGAR 8-K and 10-Q. Maps: US Census Bureau cartographic boundary files. FDA 510(k) clearances (openFDA, updated Oct 12, 2026); ClinicalTrials.gov API v2.

Business Question Brief

The problemYou need one sourced answer, and nobody on the team knows the government files.

$750per brief. Briefs come with the Group and Enterprise plans.
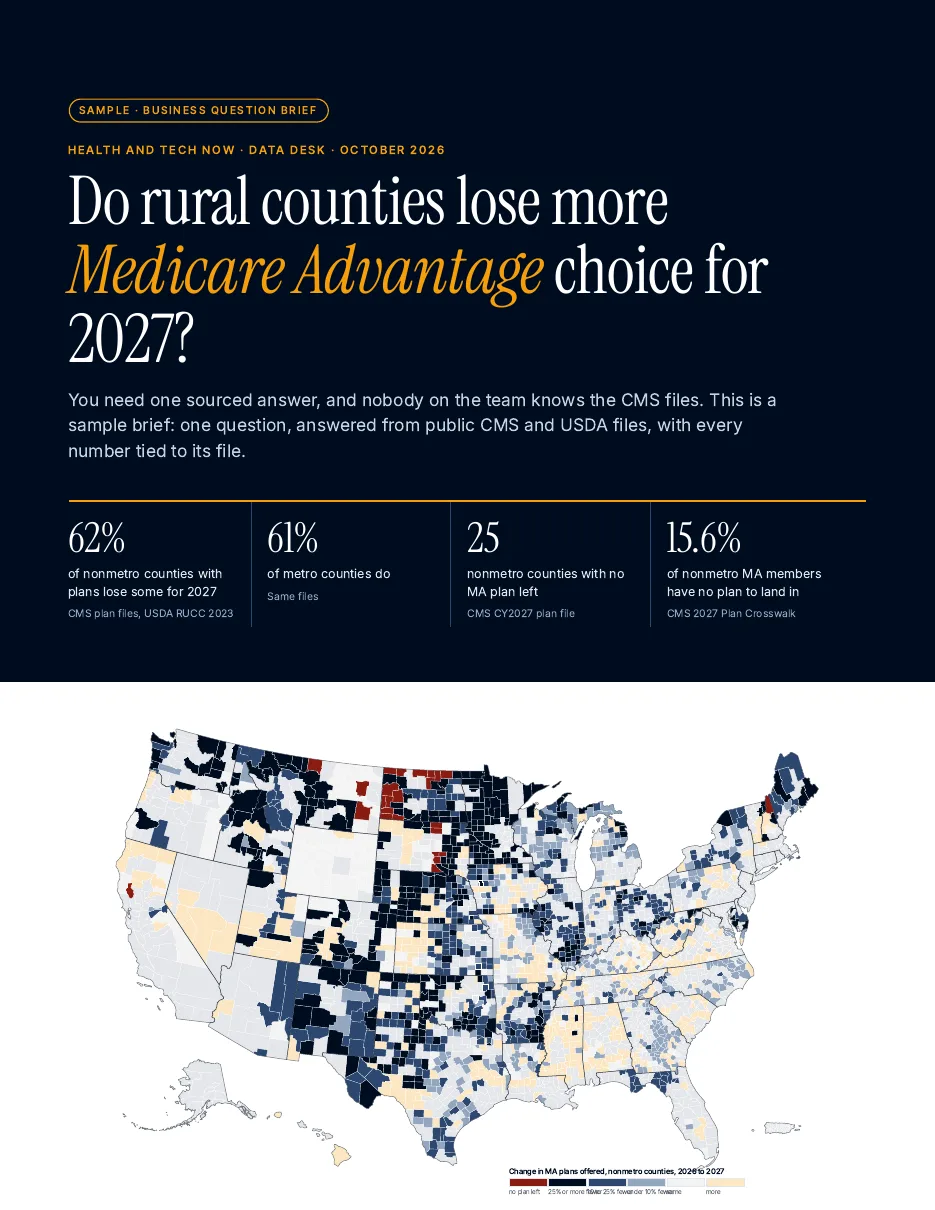
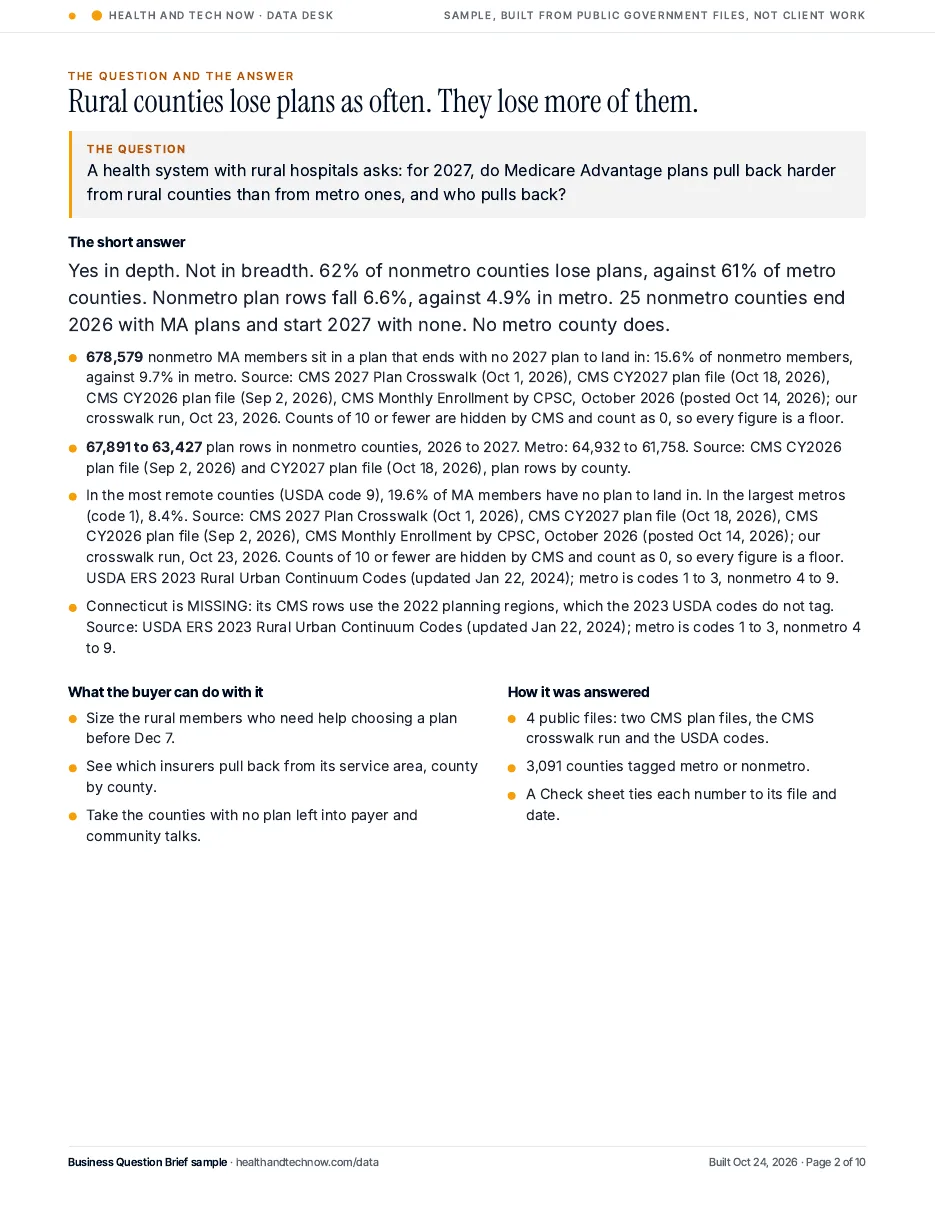
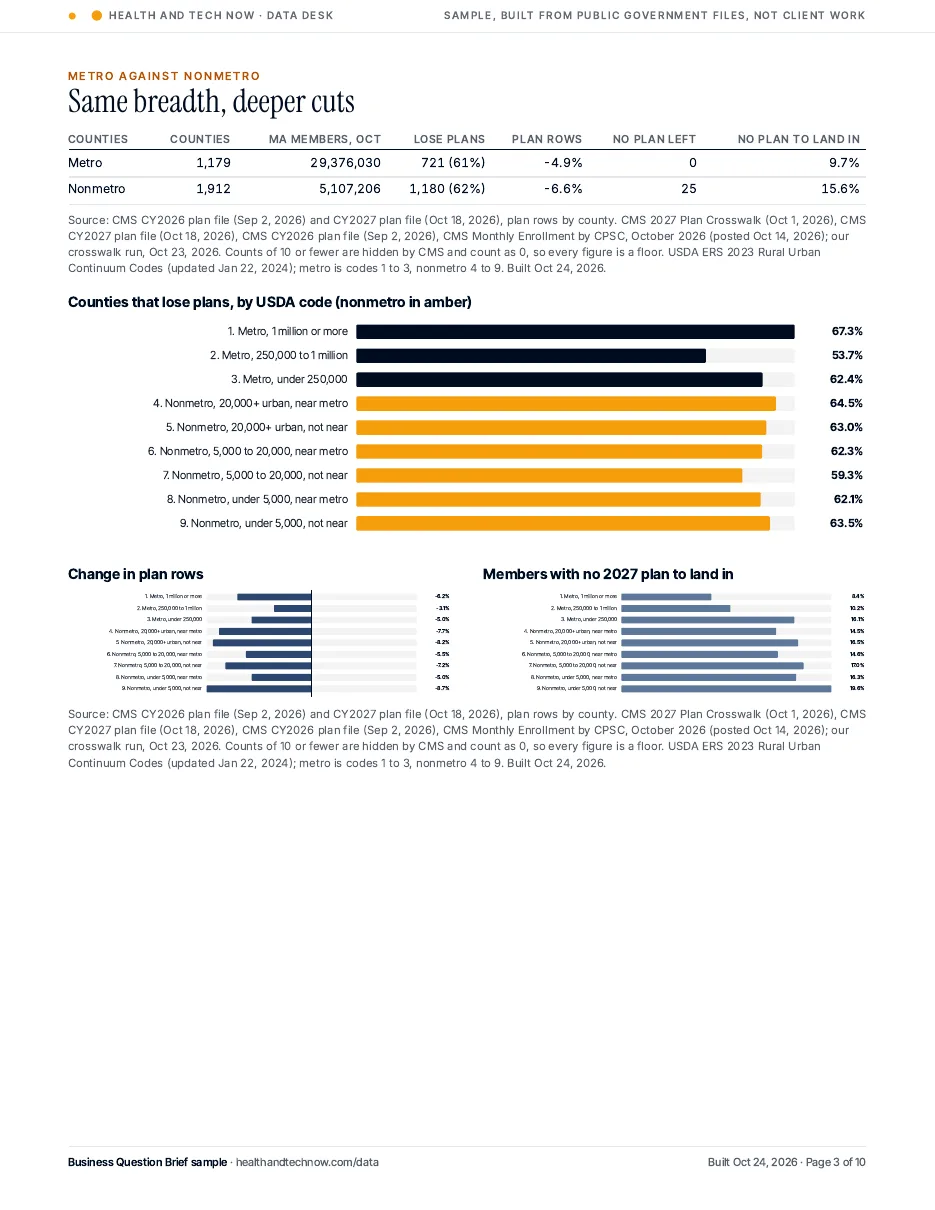
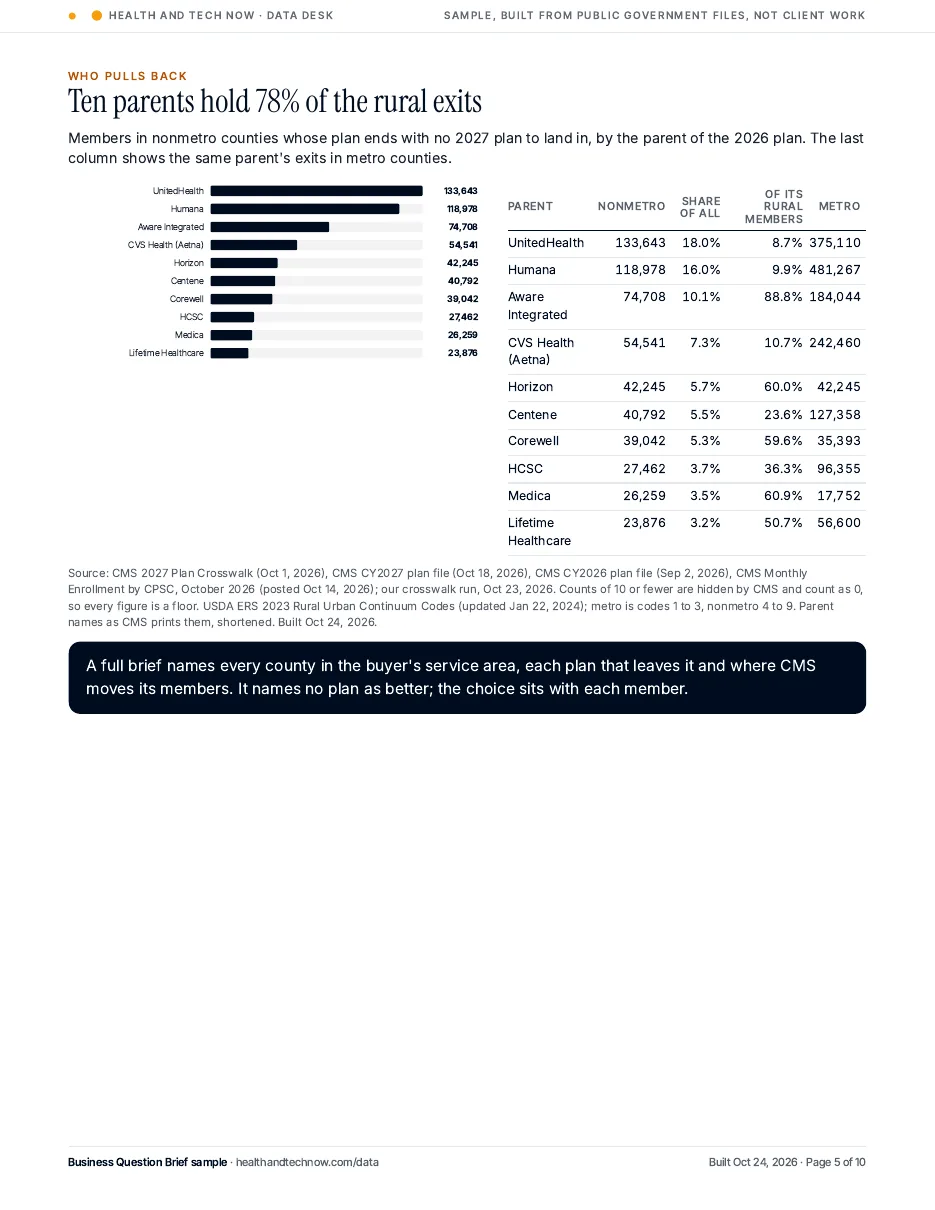
Cover of the Business Question Brief sample with a national map of plan changes in rural countiesThe question and the short answer, with sourced findingsMetro against nonmetro counties: table and bars by USDA rural urban codeParents with the most rural members whose plan ends for 2027

What you get

  • One question answered from public government files: CMS, SEC, Census, CDC and BEA
  • The short answer first, then the charts behind it
  • A Check sheet that ties every number to its file
  • The data file behind every chart

5 business days after you approve the scope.

In the sample

  • National county map: plan change in nonmetro counties
  • Metro against nonmetro table
  • Bars by USDA rural urban code
  • Map of rural members with no plan to land in
  • Parents behind the rural exits
  • The 25 counties with no MA plan left
  • Rural health page: nonmetro against metro on seniors, income and chronic disease (Census, BEA, CDC)
  • Rural against urban hospitals: Care Compare star ratings and operating margins (CMS)

Sources: CMS CY2026 and CY2027 plan files, 2027 Plan Crosswalk, Monthly Enrollment by CPSC; USDA ERS 2023 Rural Urban Continuum Codes. Maps: US Census Bureau cartographic boundary files. Census ACS 2020 to 2024; BEA per capita personal income 2024; CDC PLACES 2025 release; CMS Care Compare (Jul 22, 2026); CMS Hospital Provider Cost Reports (HCRIS).

Claim Check

The problemA company quotes a member number, and you can’t check it without matching monthly CMS files.

$1,200per claim.
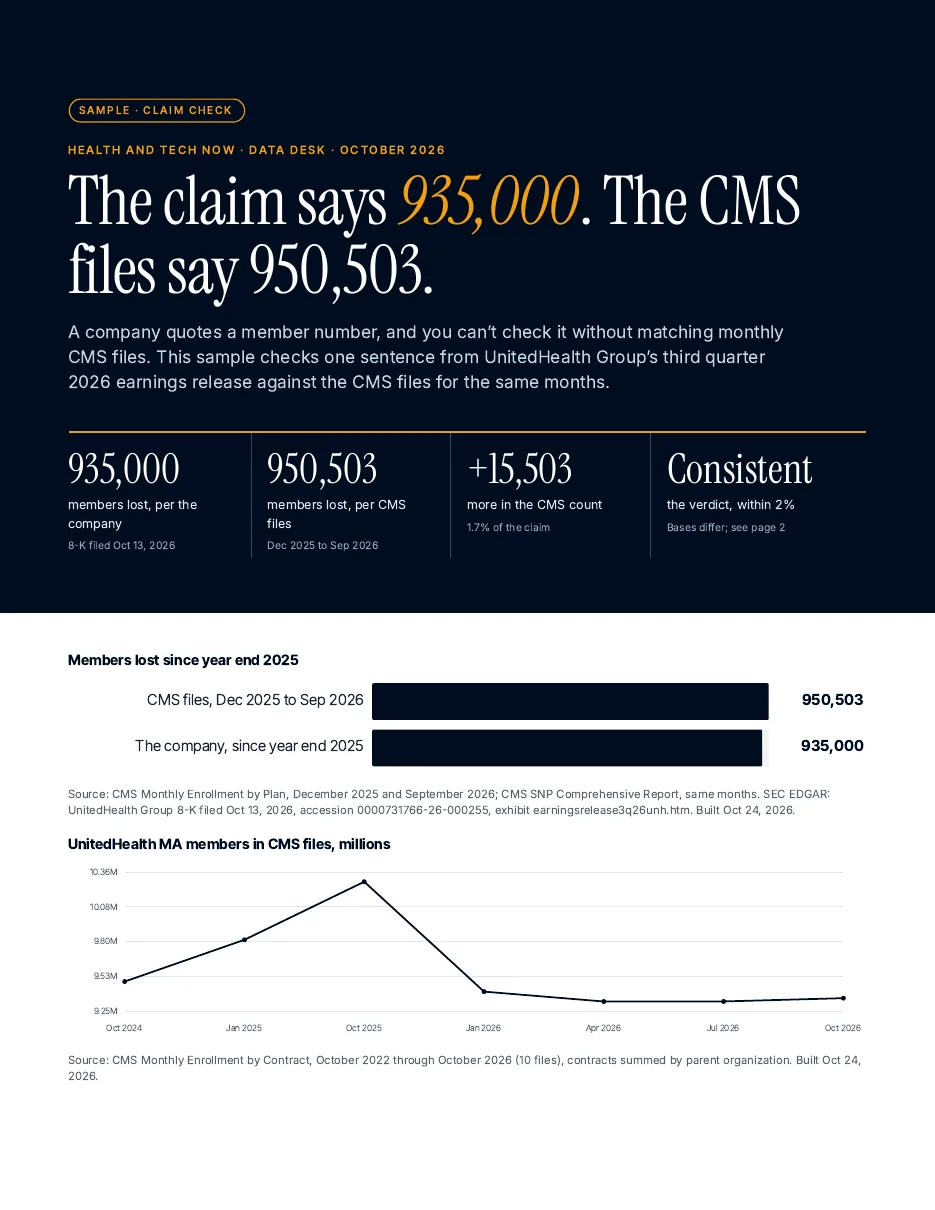
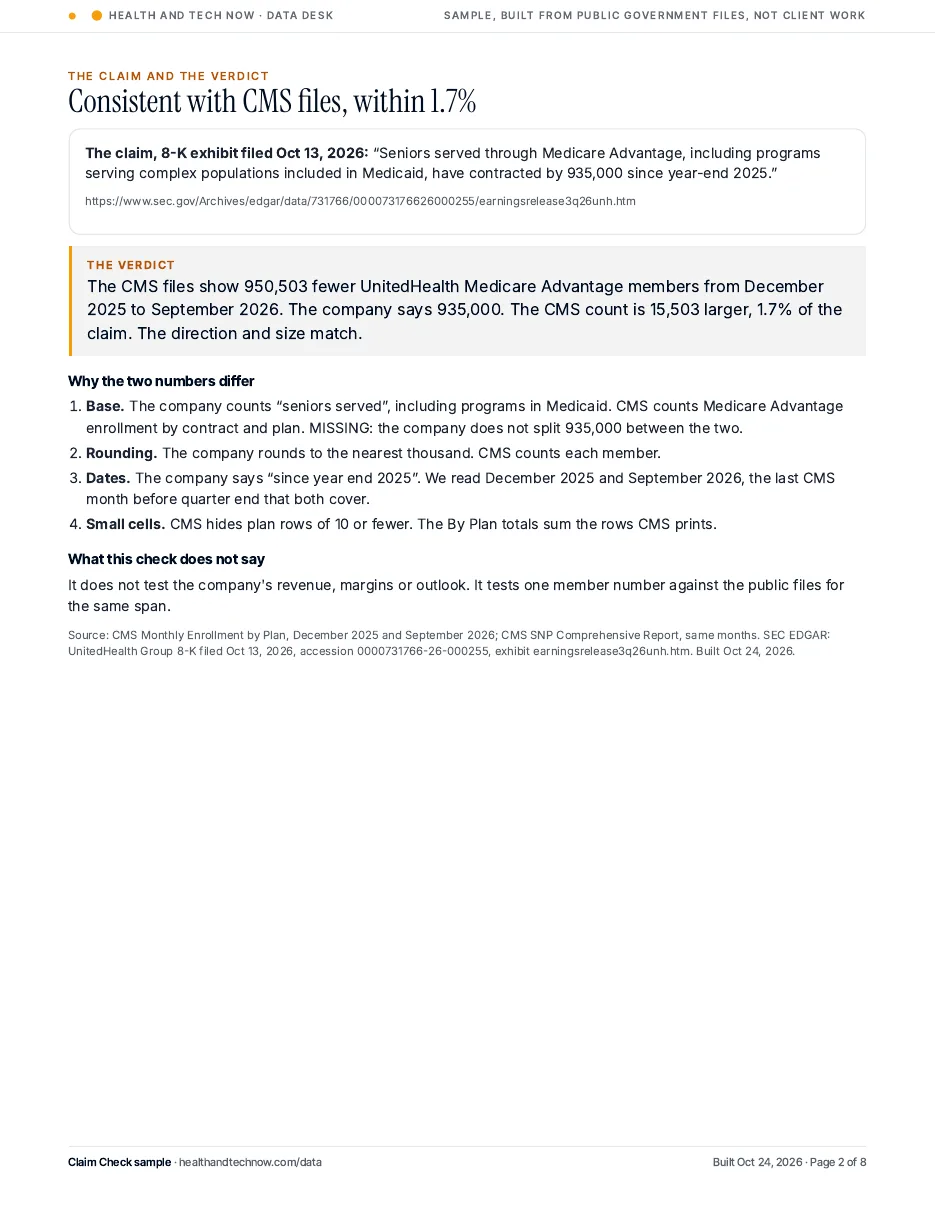
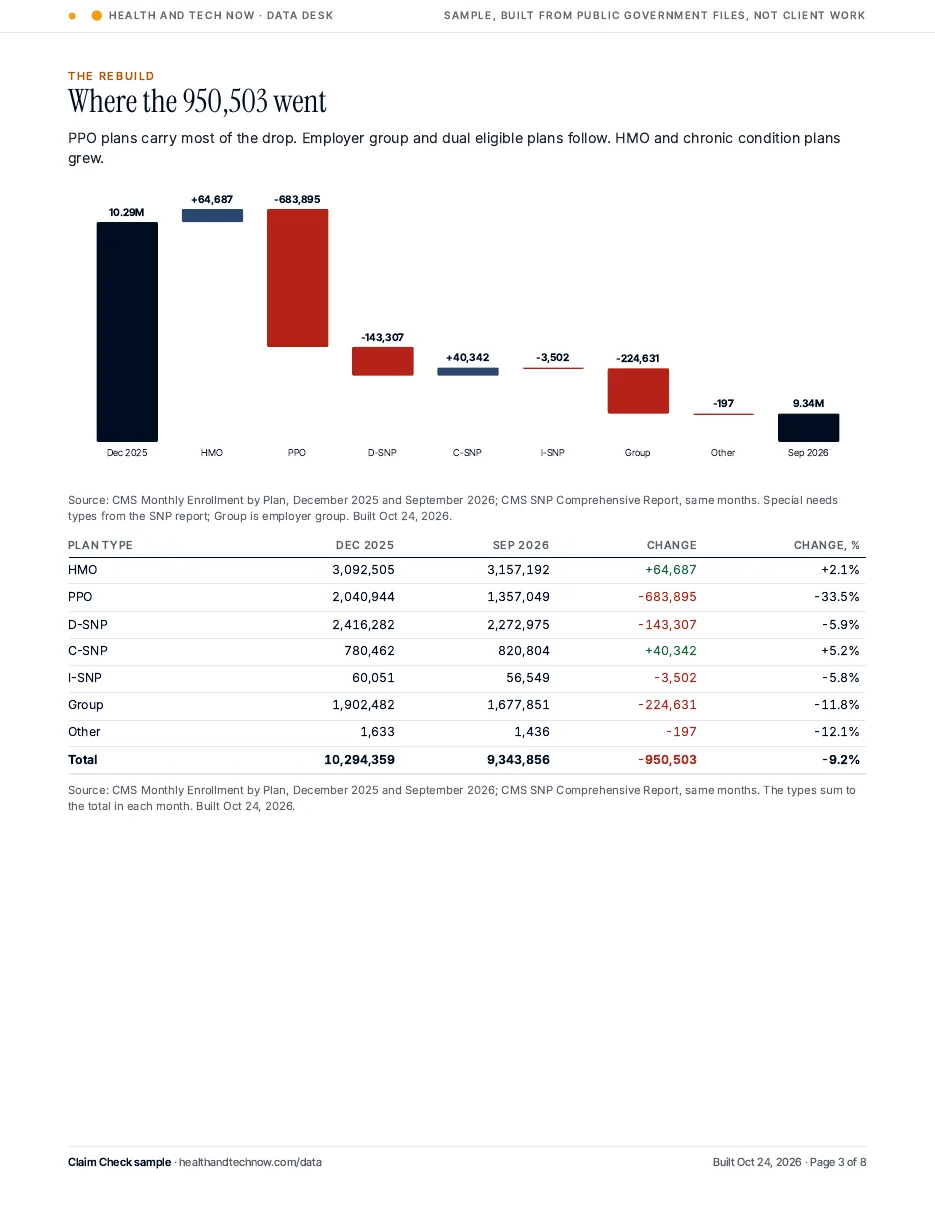
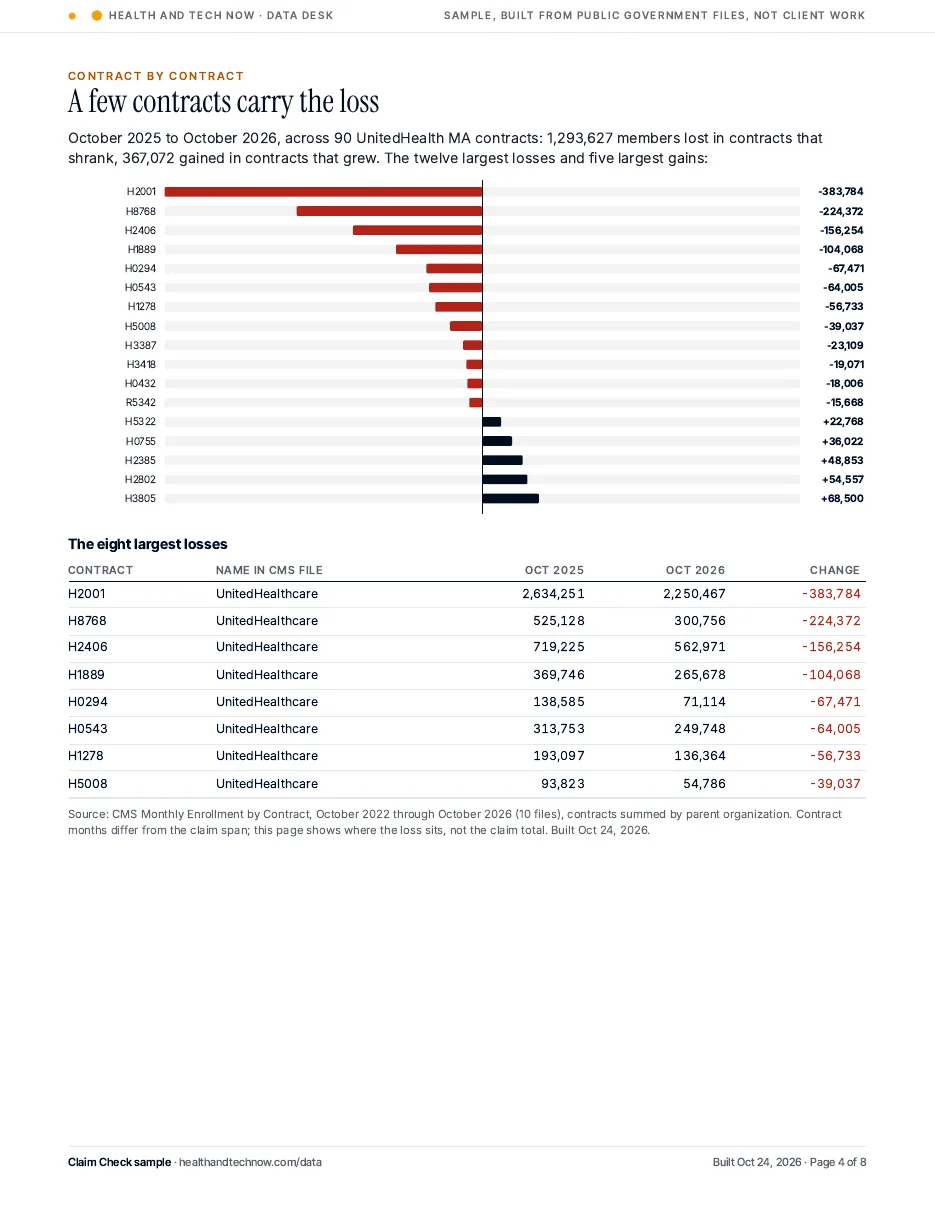
Cover of the Claim Check sample: the 8-K claim of 935,000 against the CMS countThe claim quoted from the filing and the verdictWaterfall of UnitedHealth members by plan type, December 2025 to September 2026UnitedHealth contracts with the largest member changes

What you get

  • The claim, quoted with its filing and date
  • The CMS count for the same span, rebuilt from the monthly files
  • A one line verdict, and why the numbers differ
  • A Check sheet that ties every number to its file

5 business days after you approve the scope.

In the sample

  • Claim against CMS count bars
  • Two year CMS member trend
  • Waterfall by plan type (our own graphic)
  • Contract change bars and table
  • Parent change bars and share bars
  • Federal Register box: CMS items in the last 30 days

Sources: CMS Monthly Enrollment by Plan and by Contract; SNP Comprehensive Report; SEC EDGAR 8-K (Oct 13, 2026) and 10-Q (Aug 10, 2026). Federal Register API.

AEP 2027

The October and AEP products

Built for the 2027 plan reset. AEP closes Dec 7, 2026.

AEP 2027 County Kit

The problemAEP closes Dec 7, and you still don’t know which of your clients lose their plan.

$450per state. All states: $1,500.
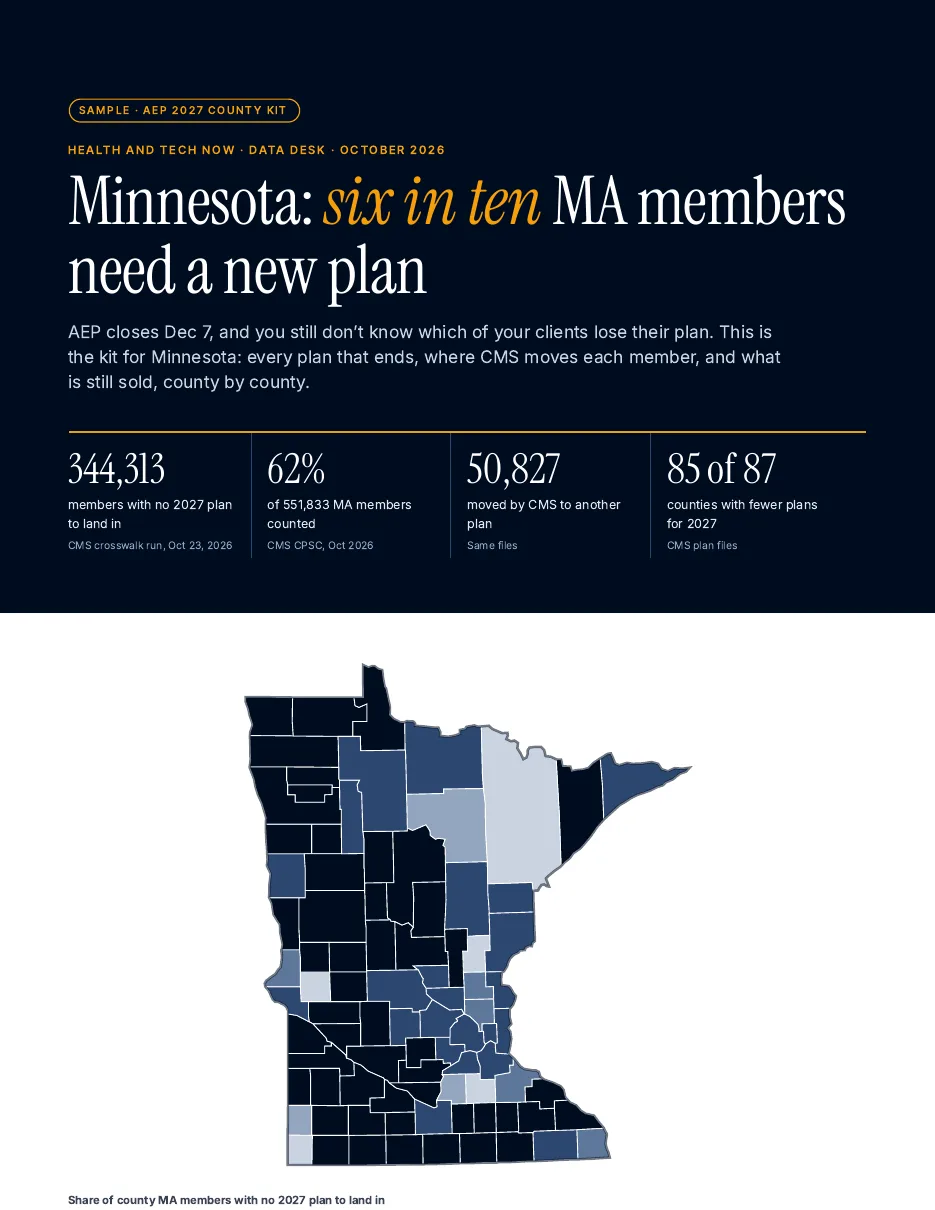
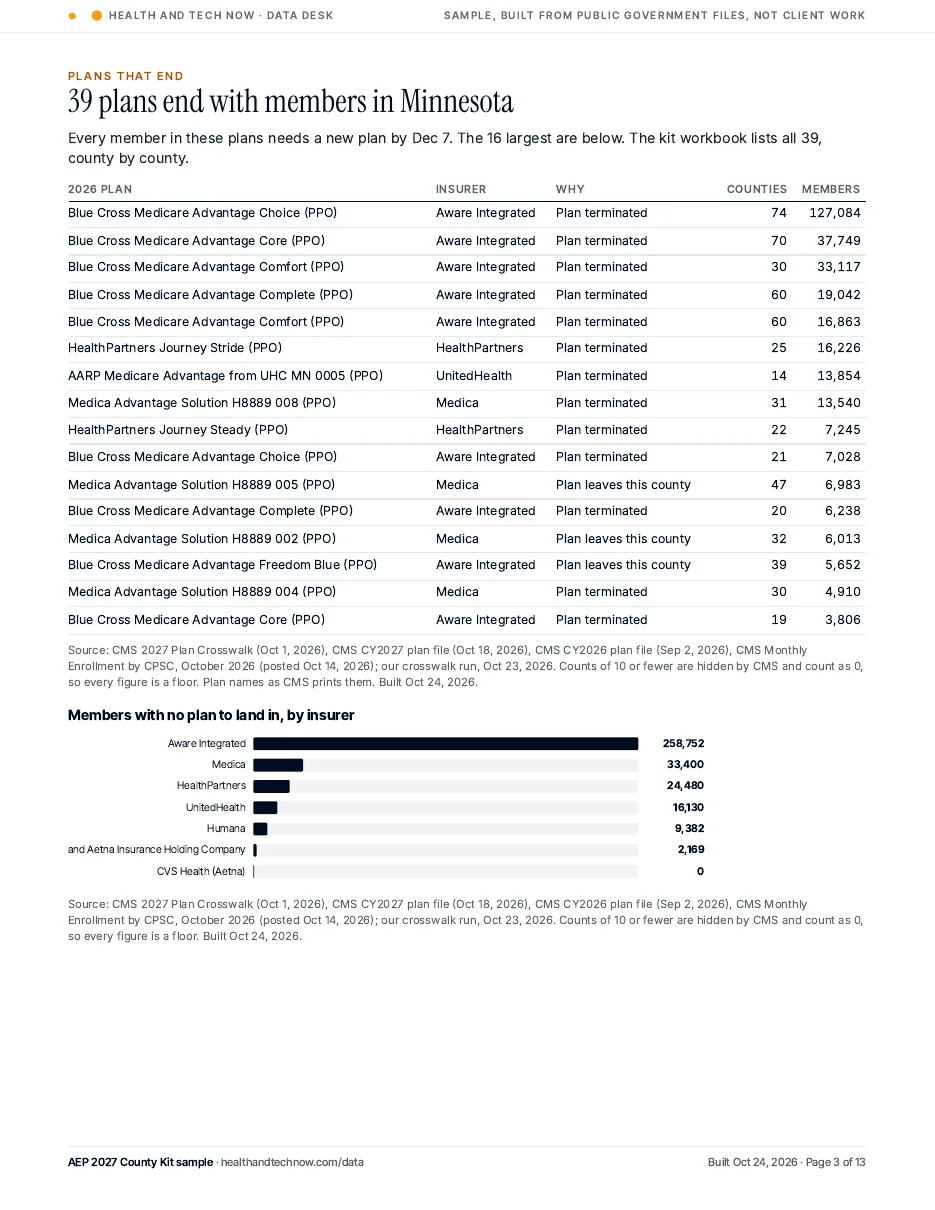
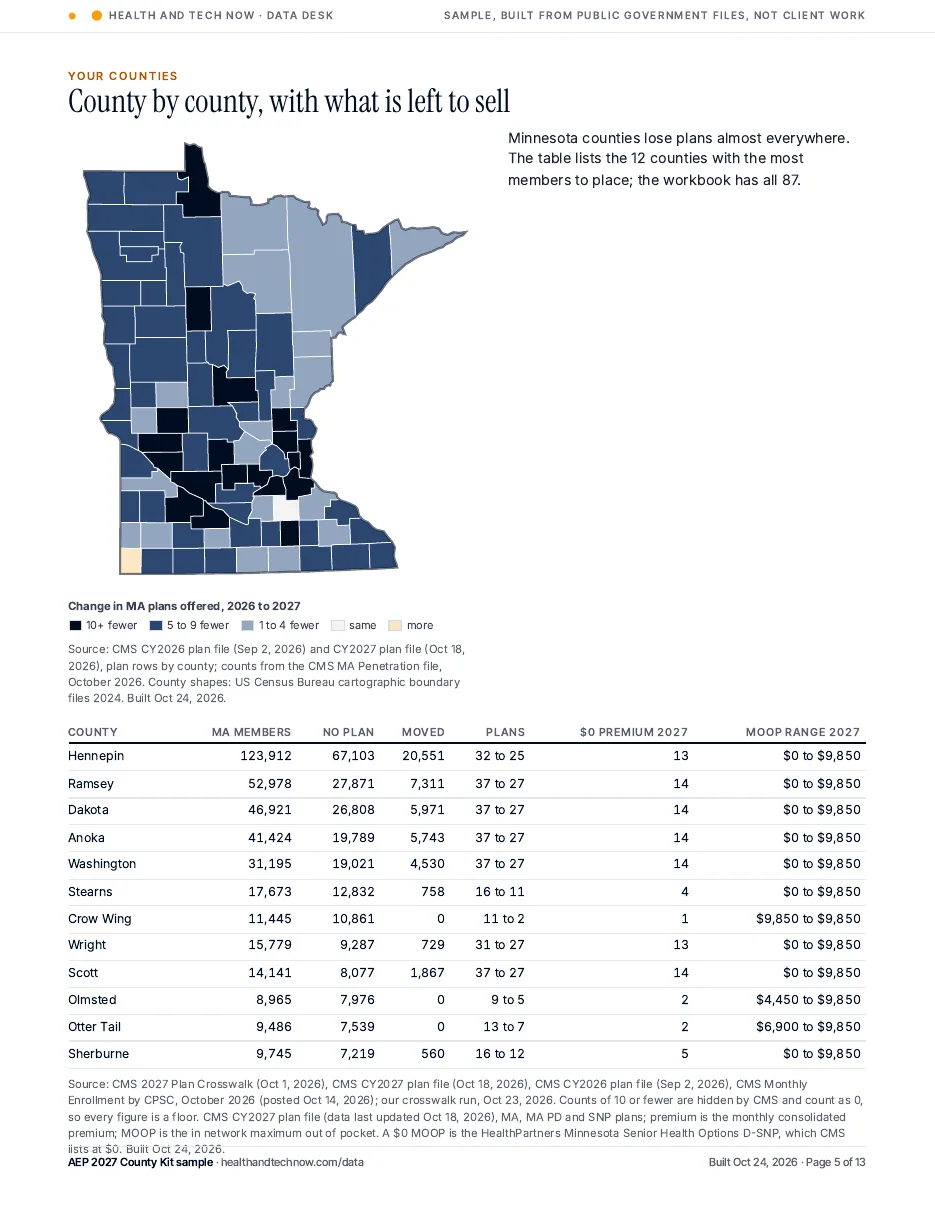
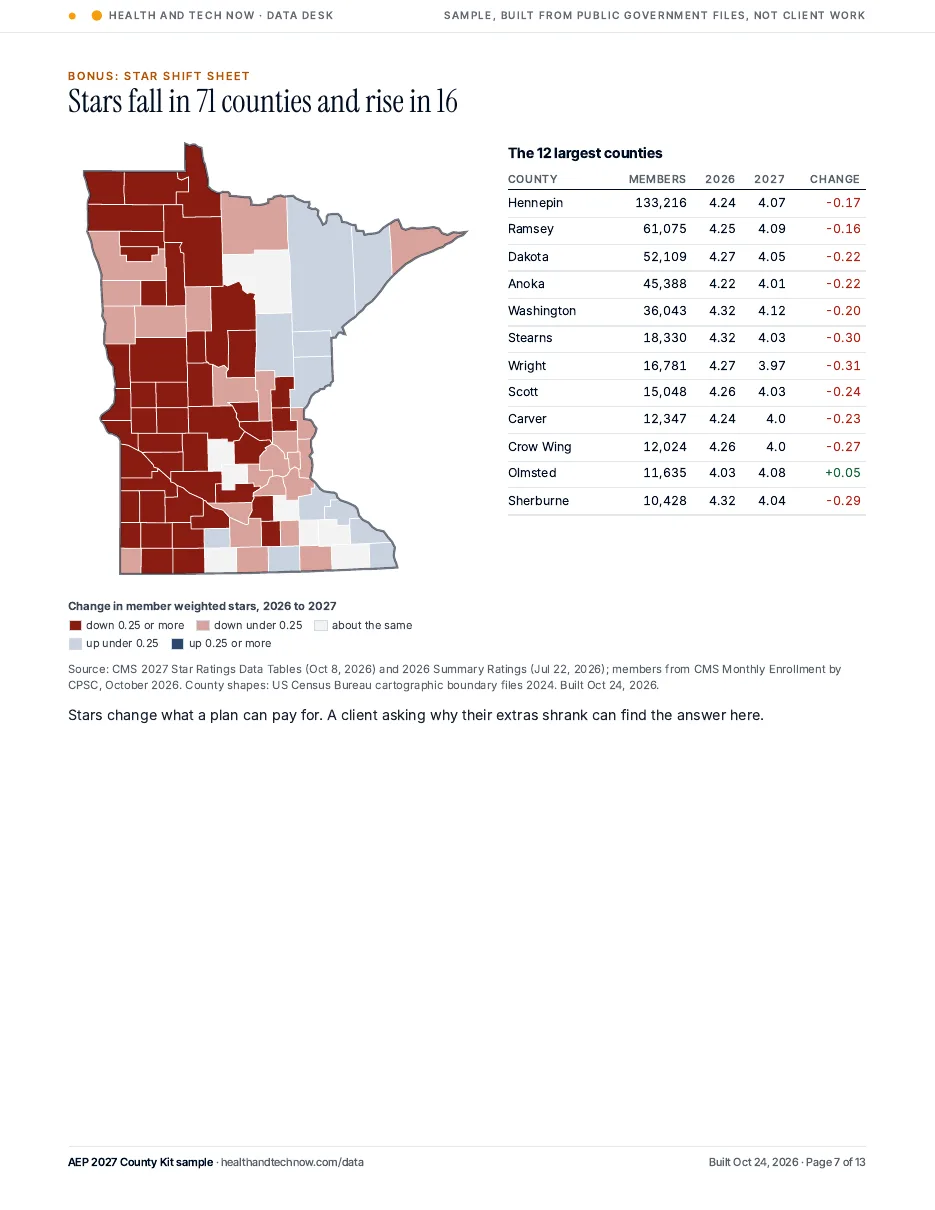
Cover of the Minnesota County Kit sample with a county map of members with no 2027 plan to land inThe 39 plans that end with members in MinnesotaCounty map of plan changes and the counties with the most members to placeStar Shift sheet: change in member weighted stars by Minnesota county

What you get

  • Every plan that ends in your counties, and how many members each one holds
  • Where CMS moves each county’s members for 2027
  • Every 2027 plan still sold, with the $0 premium count and the MOOP range
  • Kit bonuses: Spanish summary, Star Shift sheet, 4 chart cards, one free month of the State Desk, and a February Landing Report for kits bought by Dec 7

2 business days after you approve the scope. Order by Nov 30, 2026. If your kit arrives after Dec 1, 2026, it is free: we refund the full price and you keep the files.

In the sample

  • Minnesota county map: no plan to land in
  • Plans that end table and insurer bars
  • Crosswalk sheet: stay, moved, no plan
  • County map of plan changes with $0 premium and MOOP table
  • Plans still sold by insurer and MOOP
  • Star Shift map
  • Spanish summary and 4 chart cards
  • Minnesota exits per 1,000 residents 65+, with why Minnesota tops the US list
  • County map of MA members per 100 residents 65+ and an income scatter
  • County map of uninsured ages 50 to 64 (Census SAHIE) with Social Security beneficiaries 65+ (SSA)

Sources: CMS 2027 Plan Crosswalk, CY2026 and CY2027 plan files, Monthly Enrollment by CPSC, 2026 and 2027 Star Ratings. Maps: US Census Bureau cartographic boundary files. Census ACS 2020 to 2024 (table B01001); BEA per capita personal income 2024; Census SAHIE 2023; SSA OASDI Beneficiaries by State and County (Dec 2024).

County Sheet

The problemYou want to see our work on one county before you buy more.

$49per county.
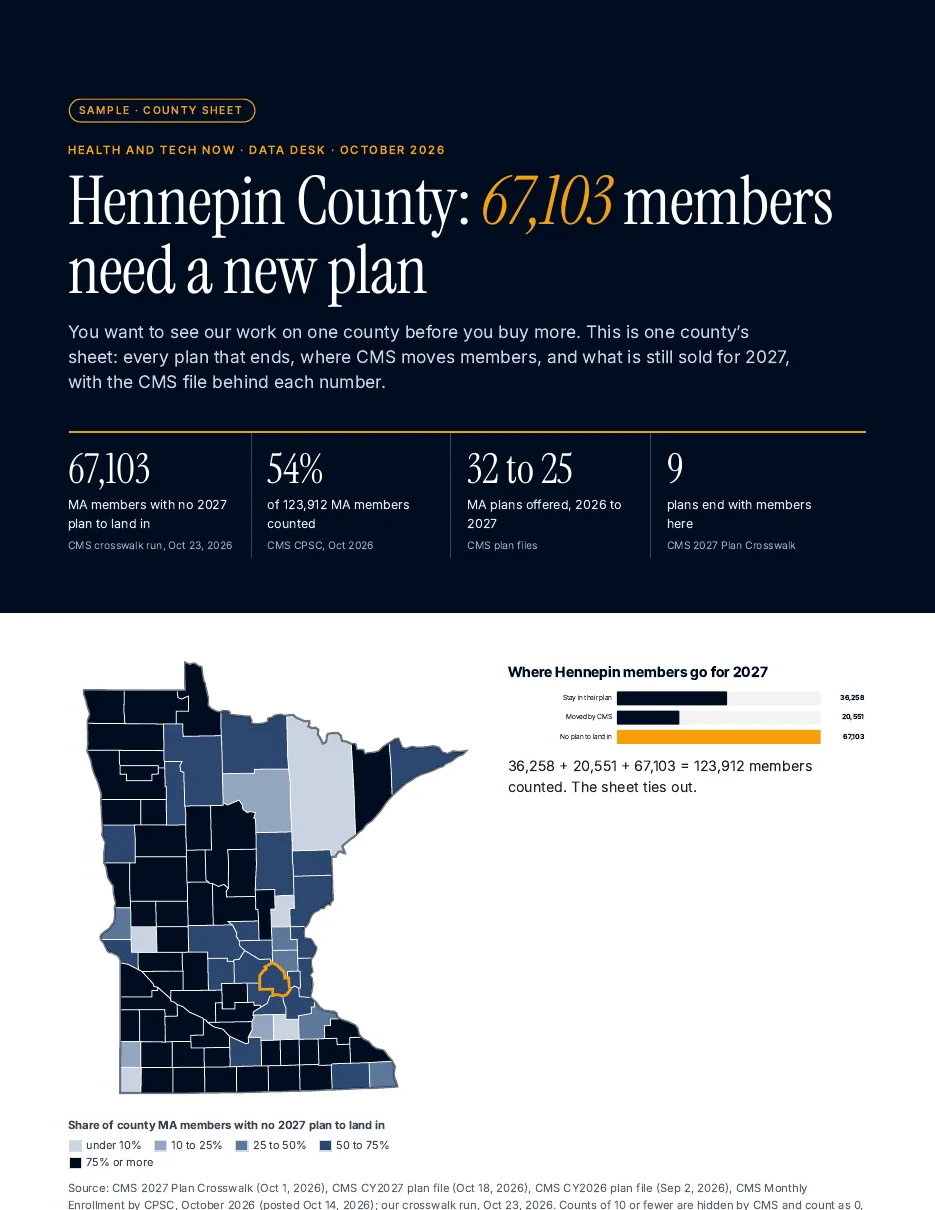
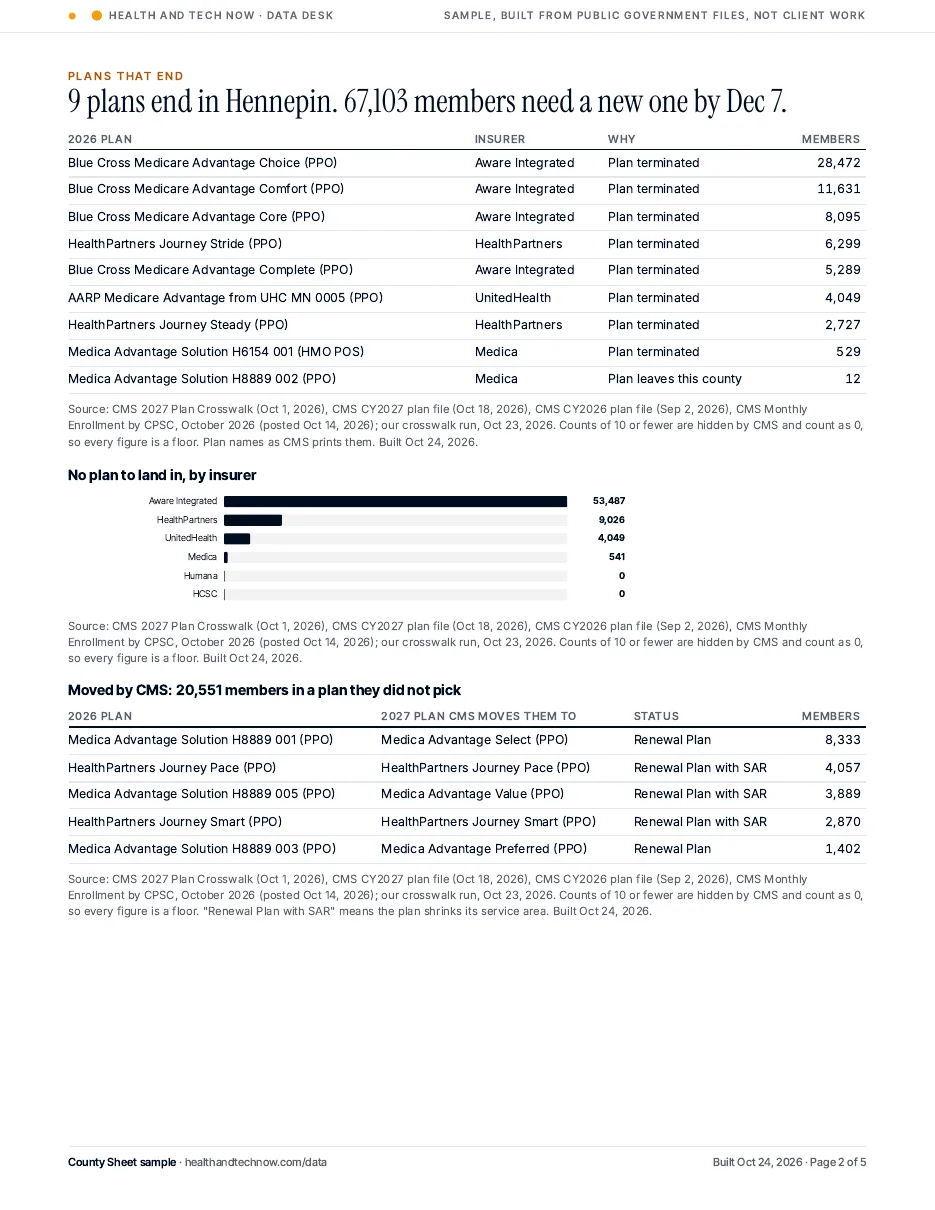
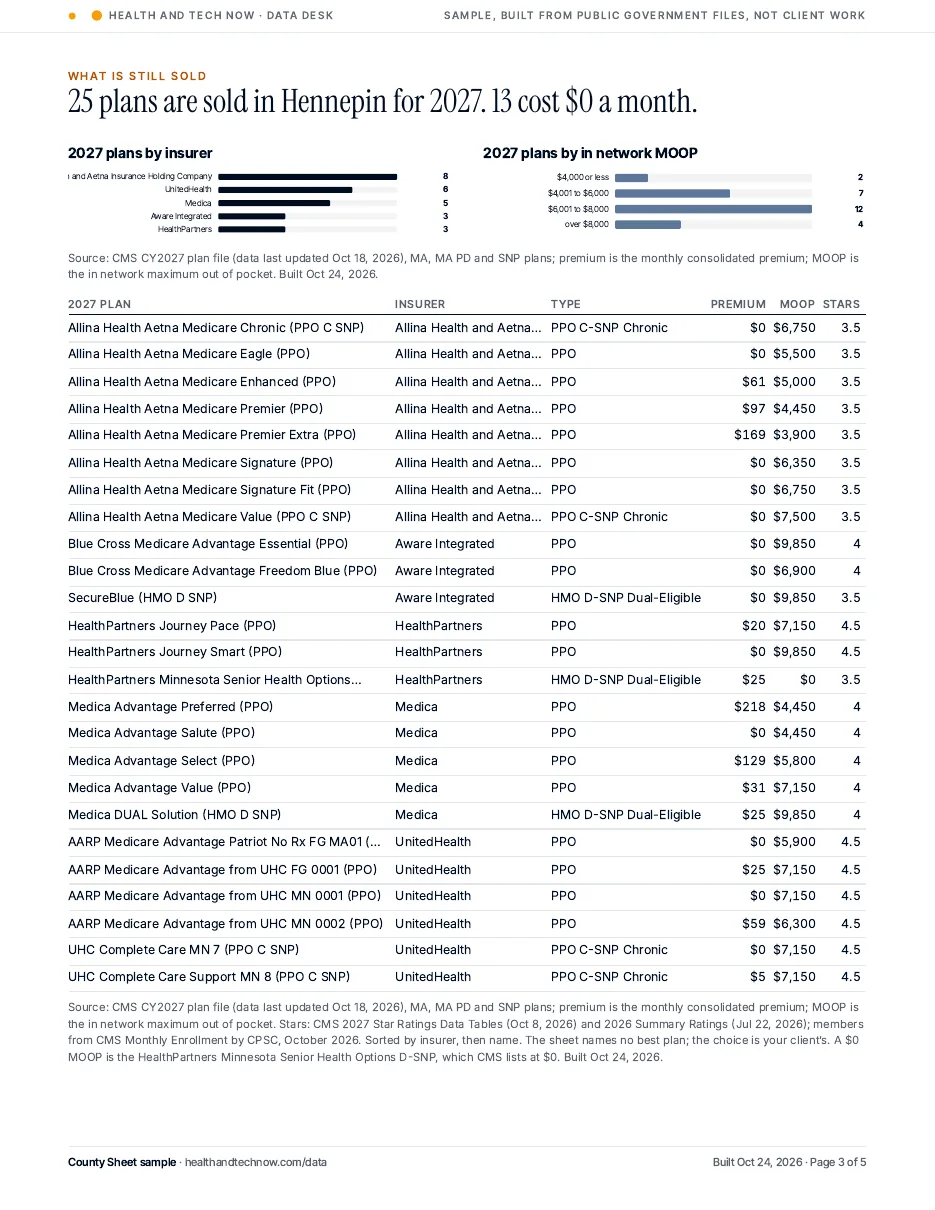
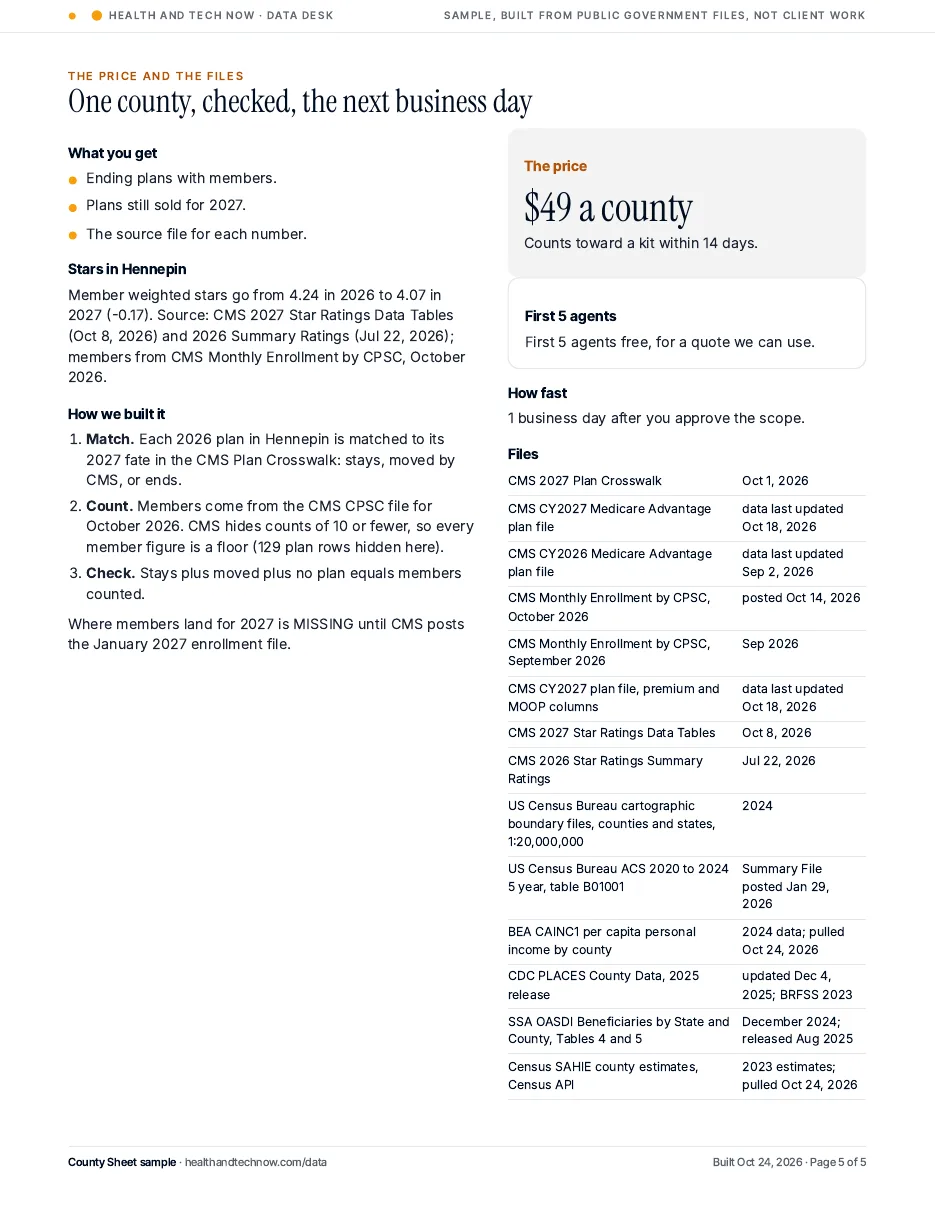
Cover of the Hennepin County Sheet sample with a Minnesota county map and where members go for 2027Plans that end in Hennepin, members by insurer, and plans CMS movesEvery 2027 plan still sold in Hennepin with premium, MOOP and starsPrice, method and the CMS files behind the sheet

What you get

  • Ending plans with members
  • Plans still sold for 2027
  • The CMS file for each number
  • Counts toward a kit within 14 days. First 5 agents free, for a quote we can use

1 business day after you approve the scope.

In the sample

  • Minnesota county map with Hennepin outlined
  • Stay, moved and no plan bars
  • Plans that end table and insurer bars
  • Plans still sold by insurer and MOOP, with the full plan table
  • Hennepin in context: residents 65+, MA members per 100 seniors, income, chronic disease, Social Security beneficiaries 65+ and uninsured ages 50 to 64

Sources: CMS 2027 Plan Crosswalk, CY2026 and CY2027 plan files, Monthly Enrollment by CPSC, 2027 Star Ratings. Maps: US Census Bureau cartographic boundary files. Census ACS 2020 to 2024; BEA per capita personal income 2024; CDC PLACES 2025 release; SSA OASDI Beneficiaries by State and County (Dec 2024); Census SAHIE 2023.
AEP 2027 County Kit for FMOs

The problemEvery agent asks for their own counties, and you build each list by hand.

$1,500per state.
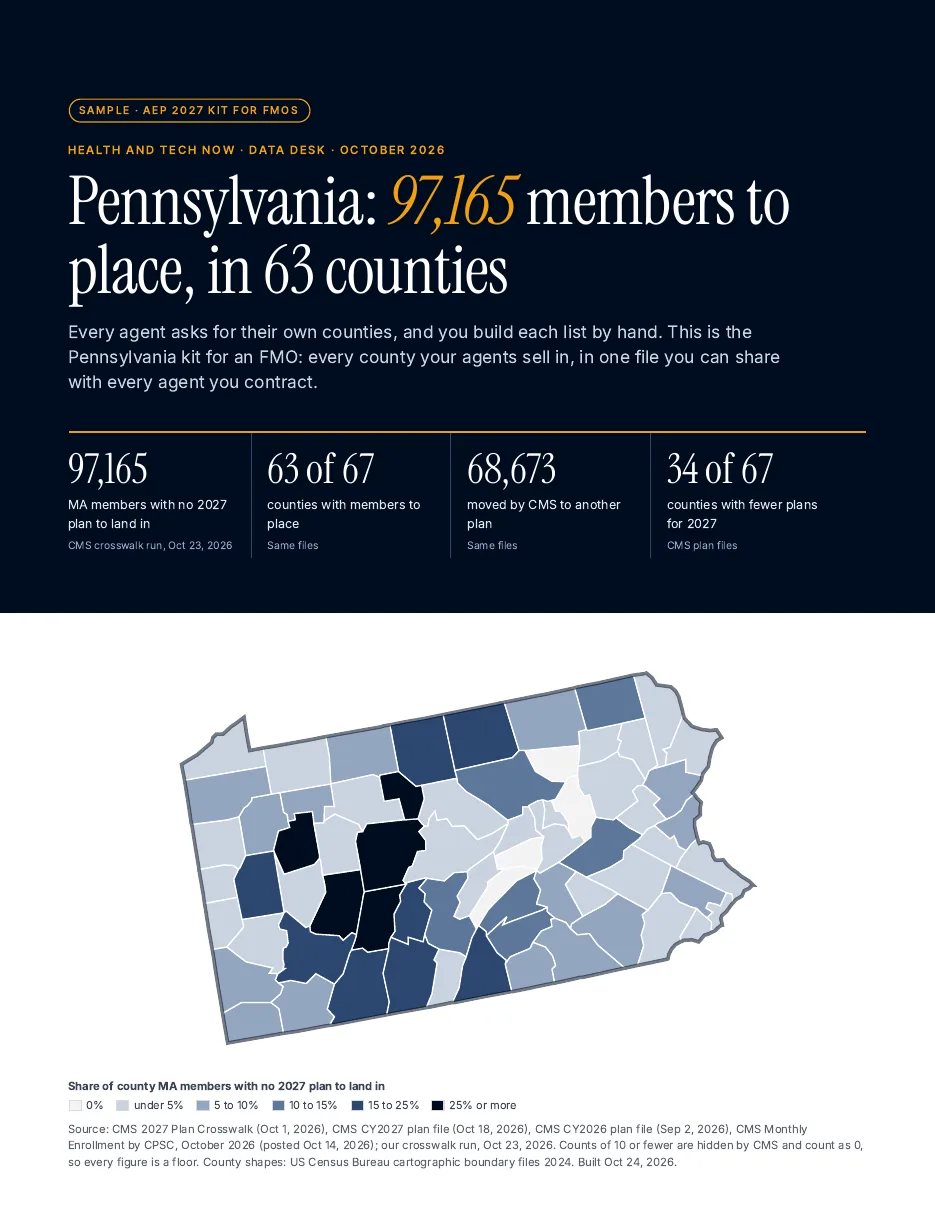
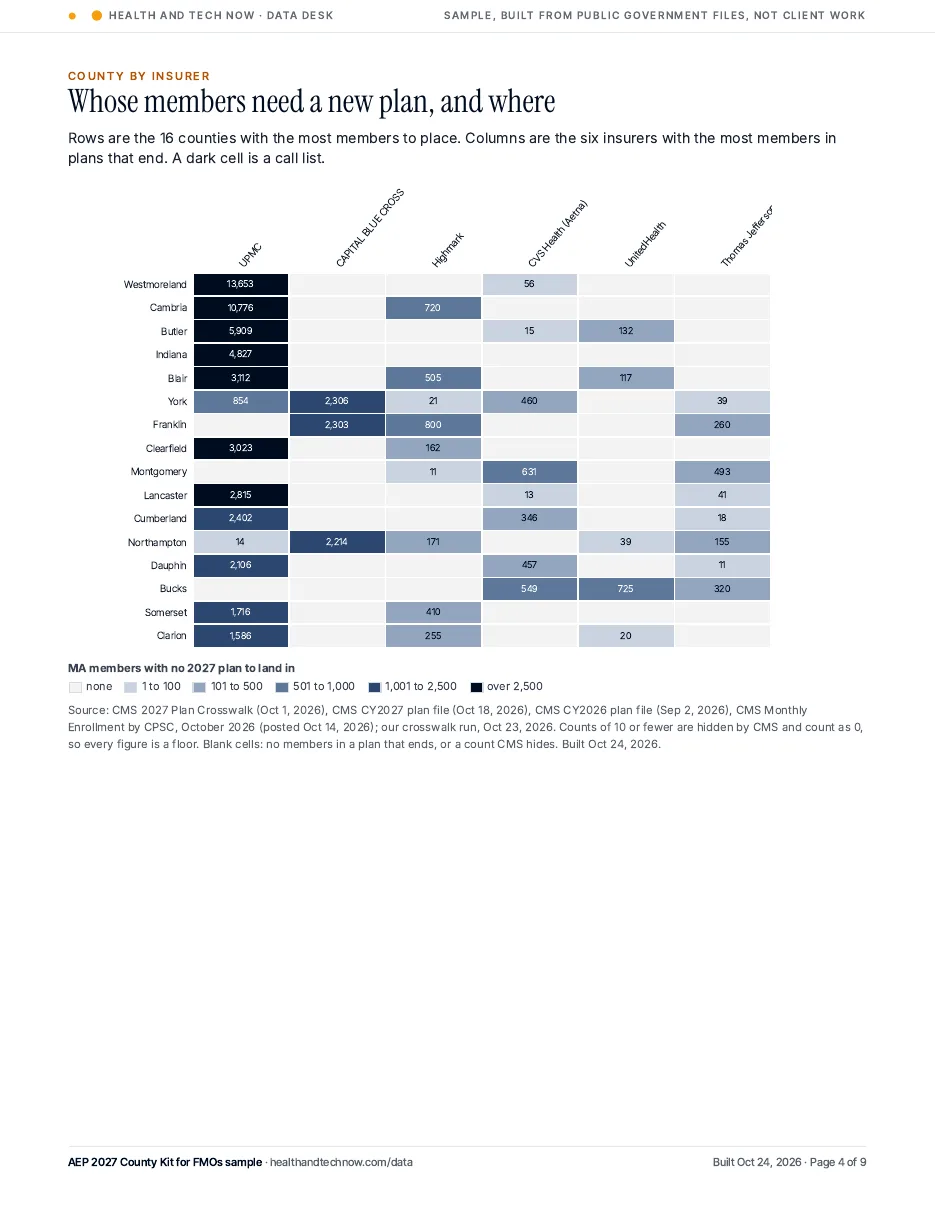
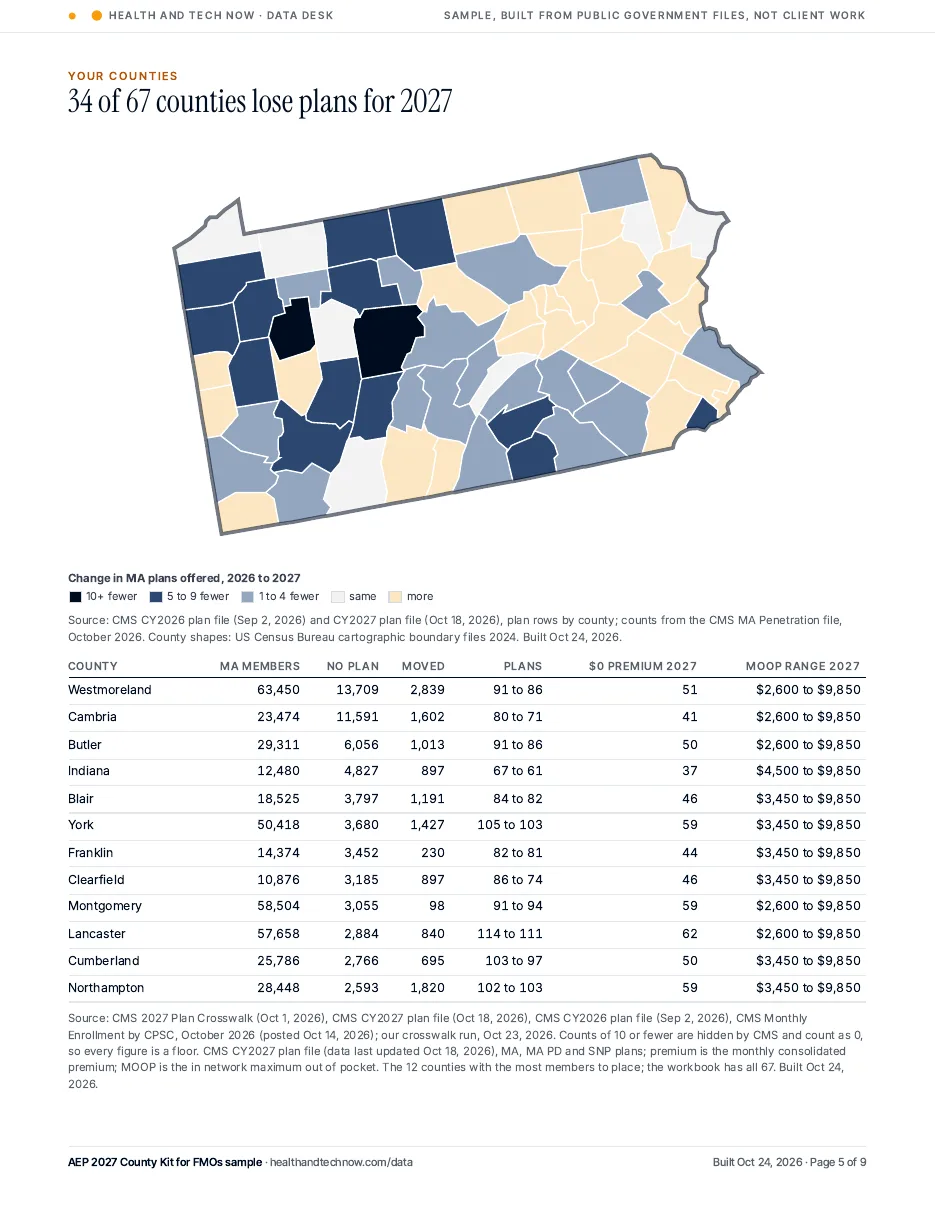
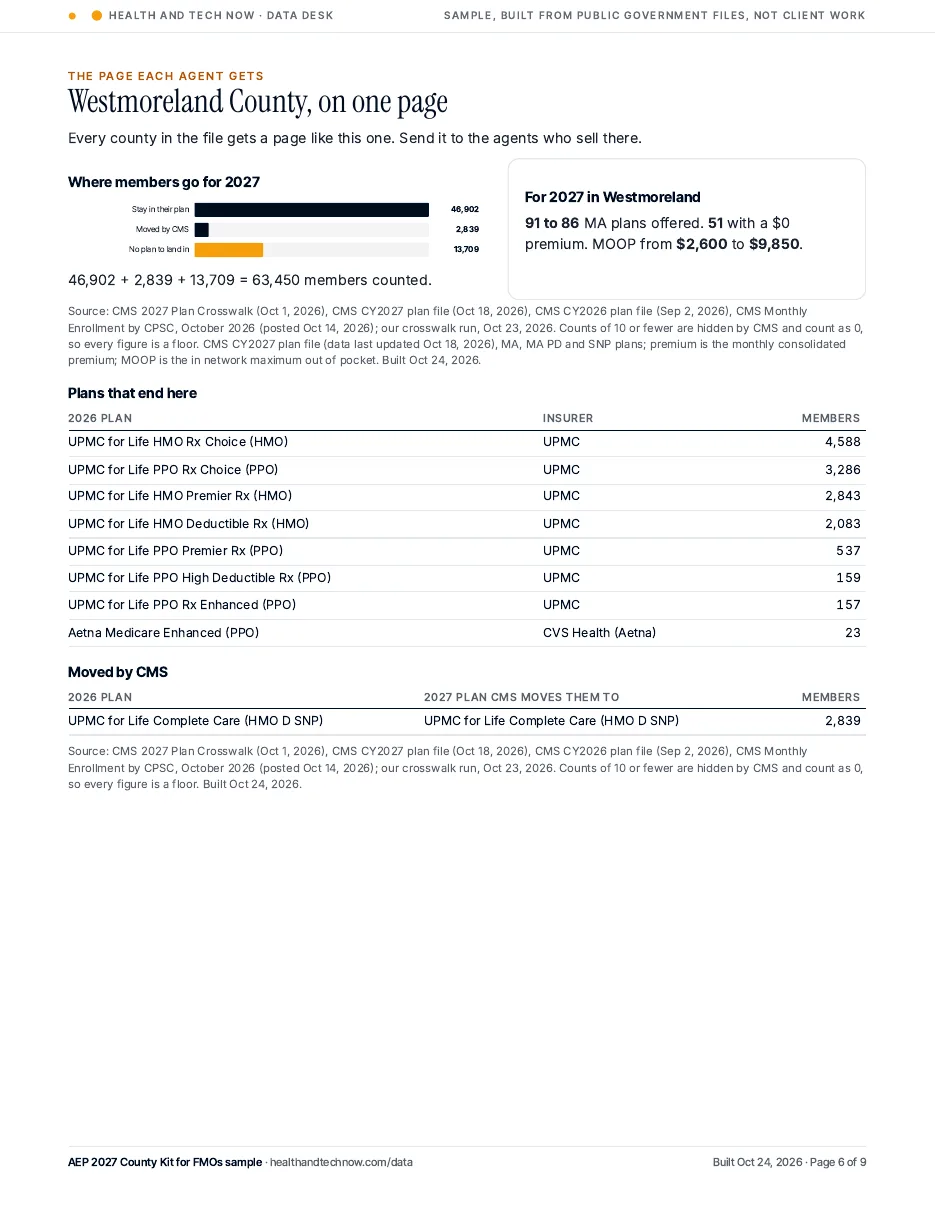
Cover of the Pennsylvania Kit for FMOs sample with a county map of members with no 2027 plan to land inHeat map of members to place by county and insurerCounty map of plan changes with the counties with the most members to placeSample agent page for Westmoreland County

What you get

  • The full kit for the state, with every county
  • The right to share it with every agent you contract
  • A county by insurer grid of members to place
  • A page for each county to send to the agents who sell there

2 business days after you approve the scope.

In the sample

  • Pennsylvania county map: no plan to land in
  • Plans that end table and insurer bars
  • County by insurer heat map
  • County map of plan changes with table
  • Agent page: stay, moved and no plan bars
  • Plans still sold by insurer and Star Shift map
  • Pennsylvania exits per 1,000 residents 65+

Sources: CMS 2027 Plan Crosswalk, CY2026 and CY2027 plan files, Monthly Enrollment by CPSC, 2026 and 2027 Star Ratings. Maps: US Census Bureau cartographic boundary files. Census ACS 2020 to 2024 (table B01001).

See pricing

Texas samples. The State Report, Agent Desk and Business level samples for Texas sit on the Texas samples page.

How we build these. Every chart carries its source file and date. Maps use US Census Bureau cartographic boundary files. Images are our own charts. A gap in a file shows as MISSING, never as a guess.