HealthcareEmployer Benefits & ACA
Out of network denials fell from 37.7% to 29.5% at the same HealthCare.gov insurers
Our analysis of CMS data for 90 insurer and state pairs that reported claims in 2022 and 2025. On a matched set, insurers overturned 25.8% of internal claim appeals, down from 43.8%.

The same HealthCare.gov insurers denied 29.5% of out of network claims in 2025, down from 37.7% in 2022. That is our analysis of CMS data for 90 insurer and state pairs that reported in both years. We held the group fixed because the set of insurers that report to CMS changed a lot over those years.
We first saw the drop in a LinkedIn post by Yubin Park, CEO of mimilabs, on Nov 1. We rebuilt his numbers from the CMS files, then went further with matched groups, state rates, in network denials and claim appeals.
Our data: the 90 matched pairs denied 9,184,940 of 31,094,529 out of network claims in 2025 and 3,154,637 of 8,361,223 in 2022. These are our sums of plan level fields in the CMS Transparency in Coverage public use files, not a CMS total.
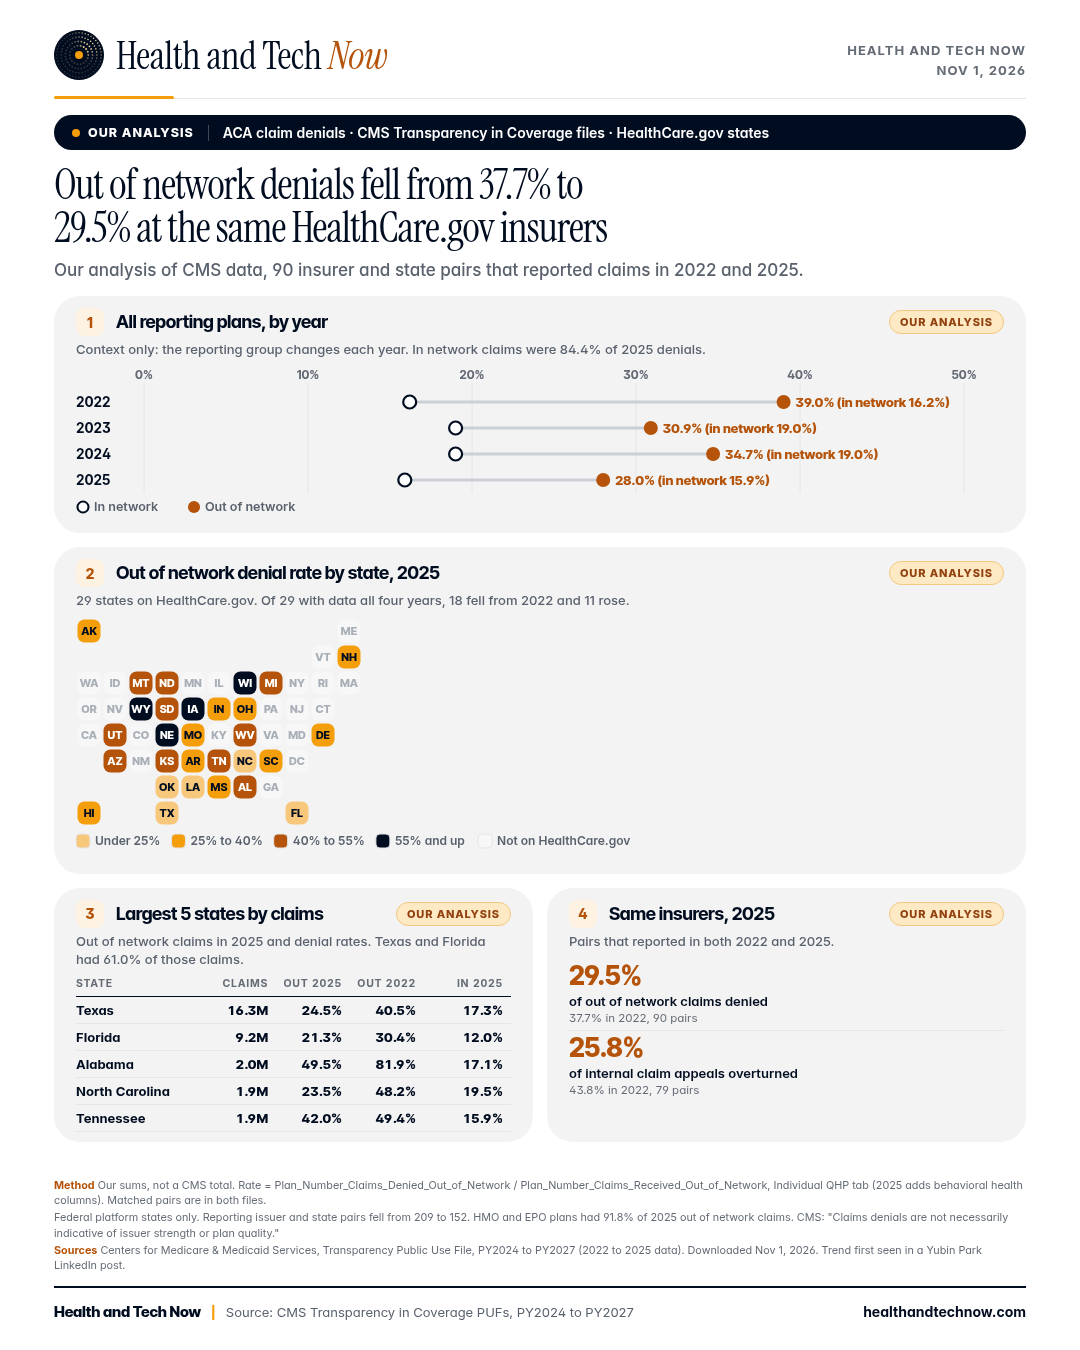
Chart: Health and Tech Now analysis of CMS Transparency in Coverage files, PY2024 to PY2027. Downloaded Nov 1, 2026.
The drop holds on matched data
The 90 matched pairs went from 37.7% to 29.5%. The 29 states with data in all four years went from 37.6% to 28.0% (CMS PY2024 and PY2027 files).
Counting every plan that reported, without matching, the rate was 39.0% in 2022, 30.9% in 2023, 34.7% in 2024 and 28.0% in 2025. Those groups differ from year to year, so we treat that series as context.
CMS also reports claims for each insurer in each state. Those insurer fields fell from 40.5% to 32.6% across all reporters. Most of that drop came from a change in which insurers reported. On the 102 insurer and state pairs that reported in both years, the insurer rate went from 36.7% to 34.7%.
Method: plan level rate = sum of Plan_Number_Claims_Denied_Out_of_Network over sum of Plan_Number_Claims_Received_Out_of_Network, Individual QHP tab. The 2025 file newly splits each field into behavioral health and other claims, and we add the two. Matched pairs: plan rows with numbers in every out of network field, grouped by state and Issuer_ID, kept if the pair appears in both the PY2024 and PY2027 files. Insurer level: Issuer_Claims_Denied_Out_of_Network over Issuer_Claims_Received_Out_of_Network, one row per insurer and state.
State by state
Oklahoma plans denied 18.7% of out of network claims in 2025, the lowest rate, on 1,217,977 claims. Nebraska plans denied 78.6%, the highest, on 36,120 claims. One insurer, Blue Cross and Blue Shield of Nebraska, denied 10,525 of its 10,535 out of network claims. Without it, the Nebraska rate is 69.8% of 25,585 claims.
Texas and Florida had 61.0% of out of network claims in 2025, so they move the combined rate most (CMS PY2027 file). Texas fell from 40.5% in 2022 to 24.5%. Florida fell from 30.4% to 21.3%.
Of the 29 states with data in all four years, 18 went down and 11 went up (CMS PY2024 and PY2027 files).
Alabama fell from 81.9% to 49.5%, and South Carolina from 68.1% to 29.8%. Louisiana rose from 7.7% to 22.3%, and Arkansas from 13.8% to 32.2%. High states moved down and low states moved up, the pattern Park described.
Rates in small states rest on few claims and few insurers. Hawaii had 4,604 out of network claims in 2025 (CMS PY2027 file).
| State | Out of network claims, 2025 | Out of network denied, 2025 | Out of network denied, 2022 | In network denied, 2025 | Internal claim appeals overturned, 2025 |
|---|---|---|---|---|---|
| Nebraska | 36,120 | 78.6% | 60.4% | 22.9% | 29.0% |
| Wisconsin | 298,420 | 58.7% | 46.5% | 18.7% | 49.5% |
| Iowa | 337,895 | 58.5% | 77.1% | 17.6% | 30.2% |
| Wyoming | 11,739 | 56.7% | 28.4% | 19.8% | 22.5% |
| Utah | 279,612 | 54.1% | 58.5% | 18.4% | 29.7% |
| South Dakota | 41,873 | 50.9% | 29.2% | 6.7% | 67.3% |
| Alabama | 1,986,645 | 49.5% | 81.9% | 17.1% | 31.7% |
| North Dakota | 25,983 | 46.6% | 41.6% | 5.4% | 66.0% |
| Montana | 52,001 | 45.7% | 32.5% | 13.0% | 26.6% |
| Arizona | 894,789 | 44.1% | 32.7% | 15.5% | 40.2% |
| Michigan | 783,583 | 42.8% | 58.7% | 23.0% | 40.4% |
| Tennessee | 1,883,890 | 42.0% | 49.4% | 15.9% | 28.5% |
| West Virginia | 26,501 | 42.0% | 65.1% | 20.2% | 21.5% |
| Kansas | 550,749 | 41.2% | 58.7% | 12.4% | 27.8% |
| Delaware | 35,180 | 39.1% | 12.8% | 20.6% | 45.1% |
| Ohio | 1,118,585 | 37.6% | 58.4% | 14.9% | 21.5% |
| Alaska | 44,457 | 35.0% | 41.4% | 13.6% | 39.3% |
| New Hampshire | 75,498 | 33.4% | 55.8% | 6.8% | 35.5% |
| Arkansas | 114,522 | 32.2% | 13.8% | 15.2% | 26.7% |
| South Carolina | 994,003 | 29.8% | 68.1% | 16.3% | 50.6% |
| Indiana | 235,099 | 28.6% | 59.2% | 11.9% | 28.3% |
| Mississippi | 356,282 | 27.6% | 49.1% | 11.6% | 39.7% |
| Missouri | 1,098,231 | 27.5% | 40.3% | 12.1% | 28.8% |
| Hawaii | 4,604 | 27.1% | 13.9% | 26.1% | 37.8% |
| Texas | 16,329,752 | 24.5% | 40.5% | 17.3% | 18.0% |
| North Carolina | 1,948,166 | 23.5% | 48.2% | 19.5% | 37.0% |
| Louisiana | 1,840,621 | 22.3% | 7.7% | 18.5% | 32.6% |
| Florida | 9,207,219 | 21.3% | 30.4% | 12.0% | 40.8% |
| Oklahoma | 1,217,977 | 18.7% | 32.3% | 16.9% | 26.0% |
Method: plan level fields summed by state, all reporting plans. Claim appeals use Issuer_Internal_Appeals_Claims_Filed and Issuer_Number_Internal_Appeals_Claims_Overturned, one row per insurer and state. PY2027 file for 2025, PY2024 file for 2022. Nebraska detail: Issuer_Name = Blue Cross and Blue Shield of Nebraska, PY2027 file.
Most denied claims are in network
In network claims are far more common, so they make up most denials. Plans denied 63,156,274 in network claims in 2025, 84.4% of all denied claims in the files. The in network denial rate was 15.9% in 2025, 16.2% in 2022, and 19.0% in both 2023 and 2024, all reporting plans.
Method: sum of Plan_Number_Claims_Denied_In_Network over Plan_Number_Claims_Received_In_Network, Individual QHP tab (2025 adds the two behavioral health columns). Share = in network denied over in network plus out of network denied.
Claim appeals overturned fewer denials
On 79 insurer and state pairs that reported claim appeals in both years, insurers overturned 43.8% in 2022 and 25.8% in 2025. The matched drop is real, and it is close to the drop across all reporters.
Across all reporters, insurers overturned 26.8% of internal claim appeals in 2025, 64,647 of 241,367 (CMS PY2027 file). In 2022 they overturned 43.1%, 47,322 of 109,826.
The 2025 file is the first to report pre service appeals in their own fields, per the CMS data dictionary. With pre service appeals added back, insurers overturned 30.0% in 2025.
One insurer filed a large share. Oscar Insurance Company in Texas had 22.4% of 2025 claim appeals filed. Texas as a whole had 37.3% of claim appeals and overturned 18.0%.
Few denials get appealed. In 2025 enrollees filed 2.6 internal claim appeals for every 1,000 claims insurers denied.
Method: sum of Issuer_Number_Internal_Appeals_Claims_Overturned over Issuer_Internal_Appeals_Claims_Filed (2025), and Issuer_Number_Internal_Appeals_Overturned over Issuer_Internal_Appeals_Filed (2022), one row per insurer and state with claim appeals filed. Matched: pairs in both files. Pre service: Issuer_Internal_Appeals_Pre_Service_Benefit_Requests_Filed and its overturned field. Per 1,000: claim appeals filed over Issuer_Claims_Denied_In_Network plus Issuer_Claims_Denied_Out_of_Network.
Why out of network denials run high
Most out of network denials come from plan design. HealthCare.gov says an HMO “generally won’t cover out-of-network care except in an emergency.” An EPO covers services “only if you go to doctors, specialists, or hospitals in the plan’s network (except in an emergency).”
HMO and EPO plans had 91.8% of out of network claims in 2025, up from 84.4% in 2022. Plans coded 9,391,760 denials in 2025 as due to an out of network provider. That equals 80.3% of out of network denials. A shift in plan mix moves the rate even when insurers review claims the same way.
Out of network denial rates in 2025 by plan type (CMS PY2027 file) were 30.6% for EPO, 27.7% for HMO, 27.3% for PPO and 11.3% for POS.
Method: plan level out of network fields grouped by Plan_Type. Out of network provider denials: Plan_Number_Claims_Denied_Due_To_Out_Of_Network_Provider, summed, over plan level out of network denials.
What these numbers do not show
The CMS data disclaimer says “Claims denials are not necessarily indicative of issuer strength or plan quality.” A high rate is not proof of a bad plan.
The files cover only states on the federal HealthCare.gov platform. That was 32 states in the 2022 data and 29 in 2025. States that run their own exchange, such as California and New York, are not in them.
Each file covers only insurers still on the exchange in the plan year it is released for. CMS says the PY2027 file “contains data from PY2025 for issuers participating in the Exchanges in PY2027.” The 2022 data has 209 insurer and state pairs, and the 2025 data has 152. Insurers report their own claims data to CMS.
The definitions shifted.
The CMS data dictionary for the 2025 data splits claims into behavioral health and other claims and says both include pharmacy point of sale claims. The 2022 dictionary names pharmacies among providers but does not mention point of sale claims. We could not confirm that the two years count pharmacy claims the same way.
The 2025 file also moved pre service appeals into their own fields, while the claim appeals field kept the same written definition.
These are our sums of CMS fields. CMS does not publish an overall denial rate from these files.
What it means for you
Open enrollment for 2027 plans started Nov 1 on HealthCare.gov. Pick a plan by Dec 15 for coverage that starts Jan 1, and by Jan 15 at the latest (HealthCare.gov). If you see doctors outside a plan’s network, check whether the plan is an HMO, EPO, PPO or POS before you pick it. If a claim is denied, you have the right to an internal appeal with your insurer and then an external review by an independent reviewer (HealthCare.gov).
How we did this
We downloaded the four most recent CMS Transparency in Coverage public use files on Nov 1, 2026. The PY2024 file holds 2022 data, and the PY2027 file holds 2025 data. We used the Individual QHP tab in each.
Cells marked as suppressed, not available or not required count as blank. Plan rates add every plan row. Insurer and appeal figures use one row per insurer and state, because CMS repeats those values on every plan row. Matched figures keep only insurer and state pairs present in both the 2022 and 2025 data.
Data citation, in the format CMS requests: Centers for Medicare & Medicaid Services. (2023). 2024, 2025, 2026 or 2027 Transparency Public Use File [Data file and data dictionary]. Retrieved from https://www.cms.gov/CCIIO/Resources/Data-Resources/marketplace-puf.html
 CMS, Transparency in Coverage PUF, PY2027 file with 2025 data (updated Oct 22, 2026; downloaded Nov 1, 2026)
- CMS, Transparency in Coverage PUF, PY2026 file with 2024 data
- CMS, Transparency in Coverage PUF, PY2025 file with 2023 data
- CMS, Transparency in Coverage PUF, PY2024 file with 2022 data
 CMS, Marketplace public use files page
- CMS, Transparency PUF Disclaimer and User Agreement, PY2027
- CMS, Transparency in Coverage PUF Data Dictionary, PY2027
- CMS, Transparency in Coverage PUF Data Dictionary, PY2024
 HealthCare.gov glossary, Health Maintenance Organization (HMO)
- HealthCare.gov glossary, Exclusive Provider Organization (EPO) plan
- HealthCare.gov, Dates and deadlines
- HealthCare.gov, Appealing a health plan decision
 Yubin Park on LinkedIn, Nov 1, 2026
 KFF

 U.S. Department of Labor